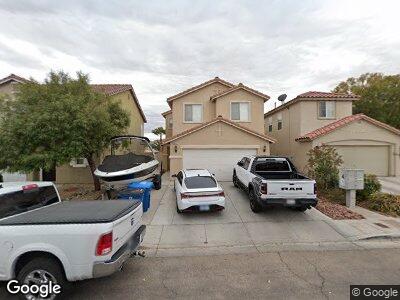
6427 Frosted Dawn Ct Las Vegas, NV 89141
Highlands Ranch NeighborhoodEstimated Value: $442,872 - $465,000
4
Beds
3
Baths
2,039
Sq Ft
$223/Sq Ft
Est. Value
About This Home
This home is located at 6427 Frosted Dawn Ct, Las Vegas, NV 89141 and is currently estimated at $453,718, approximately $222 per square foot. 6427 Frosted Dawn Ct is a home located in Clark County with nearby schools including Aldeane Comito Ries Elementary School, Lois & Jerry Tarkanian Middle School, and Desert Oasis High School.
Ownership History
Date
Name
Owned For
Owner Type
Purchase Details
Closed on
Nov 15, 2005
Sold by
Ramirez Jorge E
Bought by
Ramirez Jorge E and Campo Beatrice A
Current Estimated Value
Purchase Details
Closed on
Oct 31, 2005
Sold by
Ramirez Jorge
Bought by
Ramirez Jorge E
Purchase Details
Closed on
Oct 26, 2005
Sold by
Campo Beatrice A
Bought by
Ramirez Jorge E
Purchase Details
Closed on
Oct 17, 2005
Sold by
Ramirez Jose H and De Ramirez Bethzade Orozco
Bought by
Ramirez Jorge
Purchase Details
Closed on
Apr 30, 2005
Sold by
Ramirez Jorge Enrique
Bought by
Ramirez Jose H and Ramirez Bethzabe Orozco
Purchase Details
Closed on
Dec 2, 2004
Sold by
Campo Beatriz A
Bought by
Ramirez Jorge Enrique
Home Financials for this Owner
Home Financials are based on the most recent Mortgage that was taken out on this home.
Original Mortgage
$242,100
Interest Rate
6.37%
Mortgage Type
Stand Alone Refi Refinance Of Original Loan
Create a Home Valuation Report for This Property
The Home Valuation Report is an in-depth analysis detailing your home's value as well as a comparison with similar homes in the area
Home Values in the Area
Average Home Value in this Area
Purchase History
| Date | Buyer | Sale Price | Title Company |
|---|---|---|---|
| Ramirez Jorge E | -- | -- | |
| Ramirez Jorge E | -- | Lawyers Title Of Nevada | |
| Ramirez Jorge E | -- | Lawyers Title Of Nevada | |
| Ramirez Jorge | -- | -- | |
| Ramirez Jose H | -- | -- | |
| Ramirez Jorge Enrique | -- | First American Title Co | |
| Ramirez Jorge Enrique | $269,030 | First American Title Co |
Source: Public Records
Mortgage History
| Date | Status | Borrower | Loan Amount |
|---|---|---|---|
| Open | Ramirez Jorge E | $321,000 | |
| Closed | Ramirez Jorge Enrique | $242,100 |
Source: Public Records
Tax History Compared to Growth
Tax History
| Year | Tax Paid | Tax Assessment Tax Assessment Total Assessment is a certain percentage of the fair market value that is determined by local assessors to be the total taxable value of land and additions on the property. | Land | Improvement |
|---|---|---|---|---|
| 2025 | $1,757 | $119,609 | $36,750 | $82,859 |
| 2024 | $1,706 | $119,609 | $36,750 | $82,859 |
| 2023 | $1,706 | $109,572 | $31,500 | $78,072 |
| 2022 | $1,816 | $99,217 | $28,000 | $71,217 |
| 2021 | $1,682 | $92,154 | $24,500 | $67,654 |
| 2020 | $1,558 | $90,368 | $23,450 | $66,918 |
| 2019 | $1,461 | $85,296 | $19,600 | $65,696 |
| 2018 | $1,394 | $79,316 | $16,450 | $62,866 |
| 2017 | $2,286 | $77,943 | $14,350 | $63,593 |
| 2016 | $1,305 | $65,060 | $11,900 | $53,160 |
| 2015 | $1,302 | $57,349 | $8,750 | $48,599 |
| 2014 | $1,262 | $41,734 | $5,250 | $36,484 |
Source: Public Records
Map
Nearby Homes
- 6425 W Haleh Ave
- 6346 Rock Stream Ln
- 6390 Whispering Clouds Ct
- 6424 Bombax Ct
- 10319 Santero Bay Ct
- 6217 Lone Cypress Ct
- 10512 Mann St
- 10519 Mann St
- 10517 Longoria Garden St
- 10524 Congaree St
- 6586 Rustic Saddle Ct
- 10407 Restless River St
- 10077 Cooper Mountain St
- 6282 Dollar Bill Ct
- 6279 Dollar Bill Ct
- 5937 W Frias Ave
- 6267 Dollar Bill Ct
- 6487 W Levi Ave
- 6047 Ancient Peaks Ave
- 5904 Becklow Gardens Ave
- 6427 Frosted Dawn Ct
- 6433 Frosted Dawn Ct
- 6421 Frosted Dawn Ct
- 6415 Frosted Dawn Ct
- 6439 Frosted Dawn Ct
- 6445 Frosted Dawn Ct
- 6403 Frosted Dawn Ct
- 6428 Frosted Dawn Ct
- 6422 Frosted Dawn Ct
- 6434 Frosted Dawn Ct
- 6416 Frosted Dawn Ct
- 6440 Frosted Dawn Ct
- 6446 Frosted Dawn Ct
- 6397 Frosted Dawn Ct
- 10288 Nolinas St
- 6410 Frosted Dawn Ct
- 6410 Frosted Dawn Ct Unit n/a
- 10282 Nolinas St
- 10276 Nolinas St
- 10276 Nolinas St