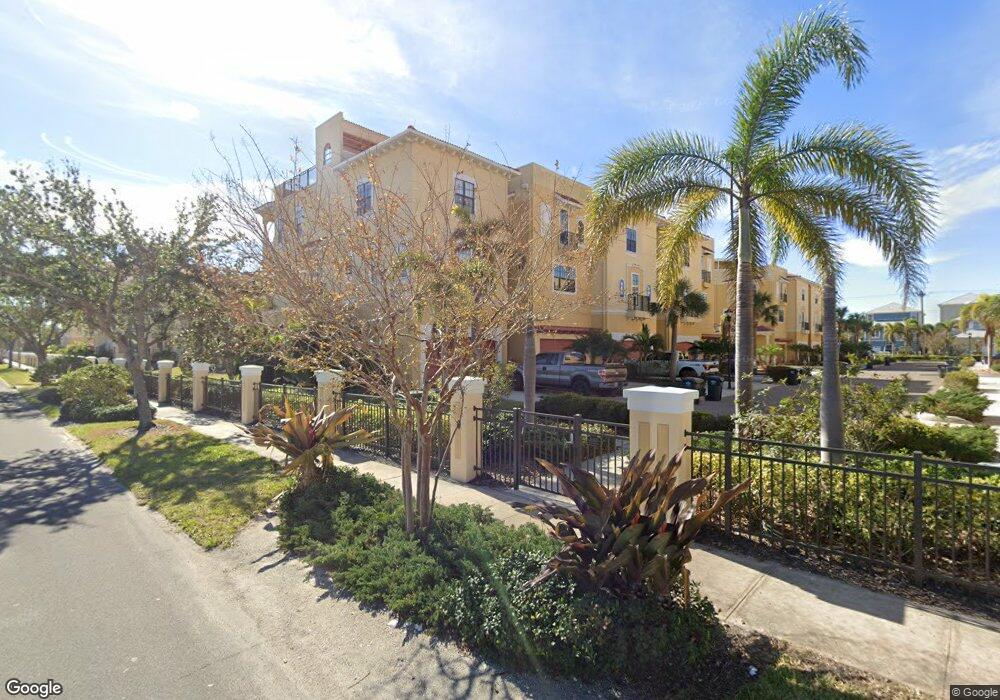
6427 Mayra Shores Ln Unit A 20 Apollo Beach, FL 33572
Estimated Value: $604,000 - $688,000
3
Beds
4
Baths
3,222
Sq Ft
$203/Sq Ft
Est. Value
About This Home
This home is located at 6427 Mayra Shores Ln Unit A 20, Apollo Beach, FL 33572 and is currently estimated at $652,969, approximately $202 per square foot. 6427 Mayra Shores Ln Unit A 20 is a home located in Hillsborough County with nearby schools including Apollo Beach Elementary School, Eisenhower Middle School, and Tioga High School.
Ownership History
Date
Name
Owned For
Owner Type
Purchase Details
Closed on
Jul 6, 2017
Sold by
Richardson Thomas C
Bought by
Richardson Thomas C and Richardson Bruce A
Current Estimated Value
Purchase Details
Closed on
Apr 20, 2016
Sold by
Richardson Philip E
Bought by
Richardson Philip E
Purchase Details
Closed on
Mar 15, 2016
Sold by
Powell Cindy Hagood
Bought by
Richardson Philip E
Purchase Details
Closed on
Mar 28, 2008
Sold by
M M & A Construction Of Florida Inc
Bought by
Powell Cindy Hagood
Home Financials for this Owner
Home Financials are based on the most recent Mortgage that was taken out on this home.
Original Mortgage
$405,201
Interest Rate
6.22%
Mortgage Type
Unknown
Create a Home Valuation Report for This Property
The Home Valuation Report is an in-depth analysis detailing your home's value as well as a comparison with similar homes in the area
Home Values in the Area
Average Home Value in this Area
Purchase History
| Date | Buyer | Sale Price | Title Company |
|---|---|---|---|
| Richardson Thomas C | -- | Attorney | |
| Richardson Philip E | -- | None Available | |
| Richardson Philip E | $341,000 | Marlin Title | |
| Powell Cindy Hagood | $506,600 | First American Title Ins Co |
Source: Public Records
Mortgage History
| Date | Status | Borrower | Loan Amount |
|---|---|---|---|
| Previous Owner | Powell Cindy Hagood | $405,201 |
Source: Public Records
Tax History Compared to Growth
Tax History
| Year | Tax Paid | Tax Assessment Tax Assessment Total Assessment is a certain percentage of the fair market value that is determined by local assessors to be the total taxable value of land and additions on the property. | Land | Improvement |
|---|---|---|---|---|
| 2024 | $7,885 | $415,456 | $38,990 | $376,466 |
| 2023 | $7,315 | $383,763 | $36,108 | $347,655 |
| 2022 | $7,102 | $382,706 | $36,003 | $346,703 |
| 2021 | $6,594 | $339,459 | $32,054 | $307,405 |
| 2020 | $6,007 | $305,768 | $28,609 | $277,159 |
| 2019 | $5,958 | $321,416 | $32,142 | $289,274 |
| 2018 | $5,375 | $267,073 | $0 | $0 |
| 2017 | $5,844 | $289,190 | $0 | $0 |
| 2016 | $5,755 | $279,751 | $0 | $0 |
| 2015 | $5,277 | $290,604 | $0 | $0 |
| 2014 | $5,258 | $288,298 | $0 | $0 |
| 2013 | -- | $192,284 | $0 | $0 |
Source: Public Records
Map
Nearby Homes
- 6418 Mayra Shores Ln
- 6413 Mayra Shores Ln
- 6411 Mayra Shores Ln
- 1450 Silvia Shores Dr
- 6407 Mayra Shores Ln
- 1421 Apollo Beach Blvd
- 1340 Apollo Beach Blvd S
- 1340 Apollo Beach Blvd S Unit S
- 1342 Apollo Beach Blvd S
- 1316 Apollo Beach Blvd S
- 6435 Marbella Blvd
- 6418 Bright Bay Ct
- 6415 Marbella Blvd
- 6451 Rubia Cir
- 6409 Marbella Blvd
- 6408 Bright Bay Ct
- 6526 Surfside Blvd
- 1207 Apollo Beach Blvd
- 6436 Rubia Cir
- 6402 Rubia Cir
- 6427 Mayra Shores Ln
- 6425 Mayra Shores Ln
- 6423 Mayra Shores Ln
- 6421 Mayra Shores Ln
- 6419 Mayra Shores Ln
- 1451 Silvia Shores Dr
- 6426 Mayra Shores Ln
- 6426 Mayra Shores Ln Unit A-10
- 6424 Mayra Shores Ln
- 6420 Mayra Shores Ln
- 1452 Silvia Shores Dr Unit B22
- 1452 Silvia Shores Dr
- 6412 Mayra Shores Ln
- 6409 Mayra Shores Ln
- 0 Surfside Blvd
- 6426 Margarita Shores Ln
- 6424 Margarita Shores Ln Unit B31
- 6424 Margarita Shores Ln
- 1450 Silvia Shores Dr Unit B21
- 6422 Margarita Shores Ln Unit A30