6427 Rustic Stone Ave Unit 102 Henderson, NV 89011
Midway NeighborhoodEstimated Value: $261,000 - $302,000
2
Beds
3
Baths
1,167
Sq Ft
$236/Sq Ft
Est. Value
About This Home
This home is located at 6427 Rustic Stone Ave Unit 102, Henderson, NV 89011 and is currently estimated at $275,797, approximately $236 per square foot. 6427 Rustic Stone Ave Unit 102 is a home located in Clark County with nearby schools including Harriet Treem Elementary School, Jim Thorpe Elementary School, and Francis H Cortney Junior High School.
Ownership History
Date
Name
Owned For
Owner Type
Purchase Details
Closed on
Feb 3, 2021
Sold by
Medina Jose Anibal and Medina Maria Nimia
Bought by
Goble Sheri
Current Estimated Value
Purchase Details
Closed on
Jan 6, 2004
Sold by
Medina Jose Anibal and Medina Maria Nimia
Bought by
Medina Jose Anibal and Medina Maria Nimia
Home Financials for this Owner
Home Financials are based on the most recent Mortgage that was taken out on this home.
Original Mortgage
$110,000
Interest Rate
4.87%
Mortgage Type
Unknown
Purchase Details
Closed on
Aug 21, 2002
Sold by
D R Horton Inc
Bought by
Medina Jose Anibal and Medina Marianimia
Home Financials for this Owner
Home Financials are based on the most recent Mortgage that was taken out on this home.
Original Mortgage
$105,712
Interest Rate
6.52%
Mortgage Type
FHA
Create a Home Valuation Report for This Property
The Home Valuation Report is an in-depth analysis detailing your home's value as well as a comparison with similar homes in the area
Home Values in the Area
Average Home Value in this Area
Purchase History
| Date | Buyer | Sale Price | Title Company |
|---|---|---|---|
| Goble Sheri | $206,000 | Chicago Title Las Vegas | |
| Medina Jose Anibal | -- | Nevada Title Company | |
| Medina Jose Anibal | $107,380 | United Title |
Source: Public Records
Mortgage History
| Date | Status | Borrower | Loan Amount |
|---|---|---|---|
| Previous Owner | Medina Jose Anibal | $110,000 | |
| Previous Owner | Medina Jose Anibal | $105,712 |
Source: Public Records
Tax History Compared to Growth
Tax History
| Year | Tax Paid | Tax Assessment Tax Assessment Total Assessment is a certain percentage of the fair market value that is determined by local assessors to be the total taxable value of land and additions on the property. | Land | Improvement |
|---|---|---|---|---|
| 2025 | $797 | $58,192 | $18,900 | $39,292 |
| 2024 | $774 | $58,192 | $18,900 | $39,292 |
| 2023 | $774 | $57,964 | $22,400 | $35,564 |
| 2022 | $752 | $51,998 | $18,200 | $33,798 |
| 2021 | $730 | $43,348 | $16,100 | $27,248 |
| 2020 | $706 | $44,622 | $16,100 | $28,522 |
| 2019 | $662 | $41,603 | $13,300 | $28,303 |
| 2018 | $631 | $37,147 | $10,150 | $26,997 |
| 2017 | $1,048 | $35,501 | $8,750 | $26,751 |
| 2016 | $592 | $33,000 | $7,350 | $25,650 |
| 2015 | $668 | $29,915 | $5,250 | $24,665 |
| 2014 | $572 | $20,256 | $4,375 | $15,881 |
Source: Public Records
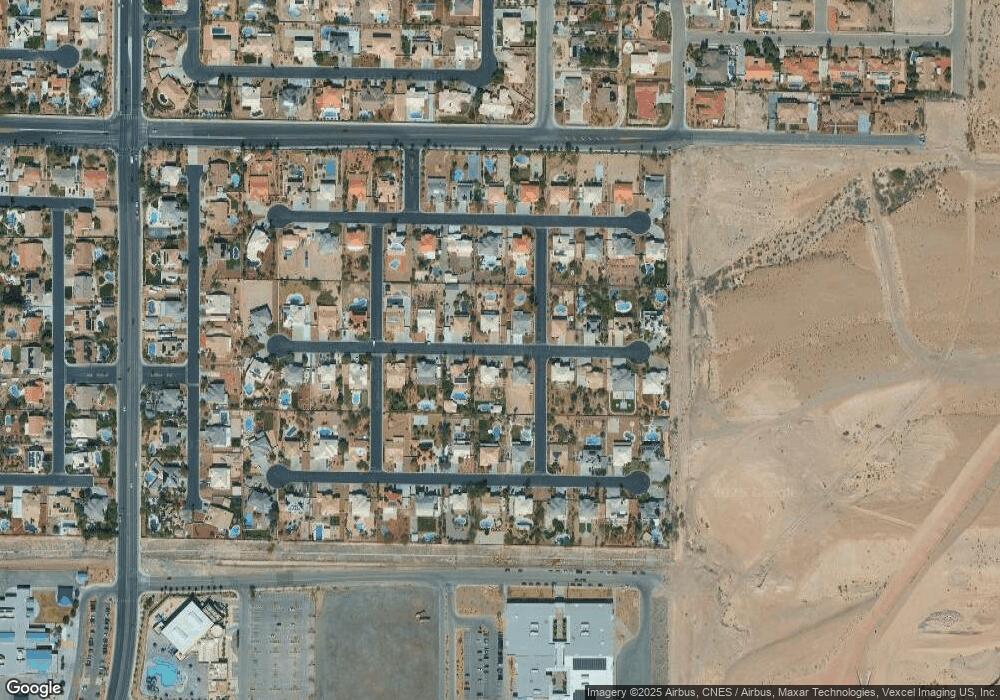
Map
Nearby Homes
- 6425 Extreme Shear Ave Unit 101
- 6412 Saddle Up Ave Unit 102
- 6064 Nestled Foot St Unit 102
- 6388 Extreme Shear Ave Unit 103
- 6021 Fiddler Ridge Trail Unit 101
- 6370 Rusticated Stone Ave Unit 102
- 6354 Rusticated Stone Ave Unit 101
- 6568 Strolling Plains Ln Unit 102
- 6576 Strolling Plains Ln Unit 101
- 5969 High Steed St Unit 101
- 5940 High Steed St Unit 101
- 5960 Trickling Descent St Unit 101
- 5983 Trickling Descent St Unit 102
- 6610 Tumbleweed Ridge Ln Unit 101
- 6080 Golden Corral Trail Unit 103
- 6332 Heavy Gorge Ave Unit 103
- 1050 Wellness Place
- 6265 Dan Blocker Ave Unit 101
- 5854 Gentleslope St
- 1151 Heliodor Ave
- 6427 Rustic Stone Ave Unit 101
- 6427 Rustic Stone Ave Unit 103
- 6427 Rusticated Stone Ave
- 6427 Rusticated Stone Ave Unit 101
- 6427 Rusticated Stone Ave Unit 102
- 6419 Rusticated Stone Ave
- 6419 Rusticated Stone Ave Unit 102
- 6419 Rusticated Stone Ave Unit 101
- 6419 Rusticated Stone Ave Unit 103
- 6419 Rustic Stone Ave Unit 102
- 6419 Rustic Stone Ave Unit 103
- 6419 Rustic Stone Ave Unit 101
- 6435 Rustic Stone Ave Unit 102
- 6435 Rustic Stone Ave Unit 103
- 6435 Rustic Stone Ave Unit 101
- 6435 Rusticated Stone Ave
- 6435 Rusticated Stone Ave Unit 102
- 6435 Rusticated Stone Ave Unit 103
- 6435 Rusticated Stone Ave Unit 101
- 6411 Rusticated Stone Ave Unit 103