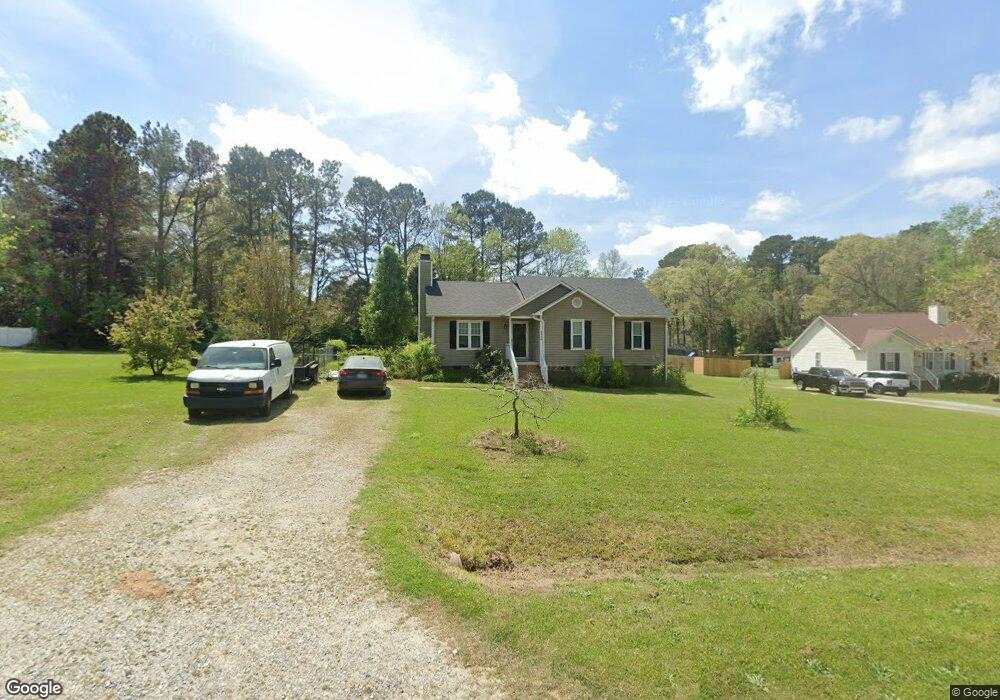
6428 Tinderbox Ln Raleigh, NC 27603
Estimated Value: $279,000 - $313,102
3
Beds
2
Baths
1,142
Sq Ft
$260/Sq Ft
Est. Value
About This Home
This home is located at 6428 Tinderbox Ln, Raleigh, NC 27603 and is currently estimated at $297,276, approximately $260 per square foot. 6428 Tinderbox Ln is a home located in Wake County with nearby schools including North Garner Middle and South Garner High.
Ownership History
Date
Name
Owned For
Owner Type
Purchase Details
Closed on
Dec 21, 2016
Sold by
Thomas Regina K
Bought by
Trepiccione Alasdair T
Current Estimated Value
Home Financials for this Owner
Home Financials are based on the most recent Mortgage that was taken out on this home.
Original Mortgage
$137,464
Outstanding Balance
$112,182
Interest Rate
3.87%
Mortgage Type
FHA
Estimated Equity
$185,094
Purchase Details
Closed on
Sep 14, 2015
Sold by
Norman Kevin Michael and Norman Lauren Meyer
Bought by
Thomas Regina K
Home Financials for this Owner
Home Financials are based on the most recent Mortgage that was taken out on this home.
Original Mortgage
$122,735
Interest Rate
4.12%
Mortgage Type
FHA
Purchase Details
Closed on
Apr 10, 2002
Sold by
Murphy Jill M
Bought by
Norman Kevin
Home Financials for this Owner
Home Financials are based on the most recent Mortgage that was taken out on this home.
Original Mortgage
$110,000
Interest Rate
7.07%
Mortgage Type
VA
Create a Home Valuation Report for This Property
The Home Valuation Report is an in-depth analysis detailing your home's value as well as a comparison with similar homes in the area
Home Values in the Area
Average Home Value in this Area
Purchase History
| Date | Buyer | Sale Price | Title Company |
|---|---|---|---|
| Trepiccione Alasdair T | $140,000 | None Available | |
| Thomas Regina K | $125,000 | Tryon Title Insurance Co | |
| Norman Kevin | $107,000 | -- |
Source: Public Records
Mortgage History
| Date | Status | Borrower | Loan Amount |
|---|---|---|---|
| Open | Trepiccione Alasdair T | $137,464 | |
| Previous Owner | Thomas Regina K | $122,735 | |
| Previous Owner | Norman Kevin | $110,000 |
Source: Public Records
Tax History Compared to Growth
Tax History
| Year | Tax Paid | Tax Assessment Tax Assessment Total Assessment is a certain percentage of the fair market value that is determined by local assessors to be the total taxable value of land and additions on the property. | Land | Improvement |
|---|---|---|---|---|
| 2025 | $1,904 | $294,543 | $85,000 | $209,543 |
| 2024 | $1,849 | $294,543 | $85,000 | $209,543 |
| 2023 | $1,311 | $165,559 | $43,000 | $122,559 |
| 2022 | $1,216 | $165,559 | $43,000 | $122,559 |
| 2021 | $1,183 | $165,559 | $43,000 | $122,559 |
| 2020 | $1,164 | $165,559 | $43,000 | $122,559 |
| 2019 | $1,074 | $129,003 | $40,000 | $89,003 |
| 2018 | $988 | $129,003 | $40,000 | $89,003 |
| 2017 | $937 | $129,003 | $40,000 | $89,003 |
| 2016 | $919 | $129,003 | $40,000 | $89,003 |
| 2015 | -- | $122,004 | $32,000 | $90,004 |
| 2014 | -- | $122,004 | $32,000 | $90,004 |
Source: Public Records
Map
Nearby Homes
- 6408 Glen Brack Ct
- 170 Sallyport Ct
- 408 Johnston Rd
- 120 Line Dr
- 272 Travel Lite Dr
- 392 Travel Lite Dr
- 221 Old Hickory Dr
- 48 Banbury Ct
- 595 Durwood Dr
- 6257 Oak Passage Dr
- 618 Durwood Dr
- 6908 Longridge Dr
- 1004 Snow Peak Ct
- 113 Hogan Dr
- 1153 Polo Dr
- 648 Fieldtrial Cir
- 102 Dandy Flush Ct
- 6313 Southern Charm Ln
- 6121 Catandpolly Ln
- 413 Fieldtrial Cir
- 6424 Tinderbox Ln
- 6432 Tinderbox Ln
- 5201 Bridget Dr
- 5105 Bridget Dr
- 5205 Bridget Dr
- 6436 Tinderbox Ln
- 6429 Tinderbox Ln
- 6416 Tinderbox Ln
- 5101 Bridget Dr
- 6437 Tinderbox Ln
- 5104 Bridget Dr
- 6433 Tinderbox Ln
- 5209 Bridget Dr
- 1112 Forest Glen Dr
- 1116 Forest Glen Dr
- 6408 Tinderbox Ln
- 5204 Bridget Dr
- 1120 Forest Glen Dr
- 10601 Gardenia Ct
- 5208 Bridget Dr