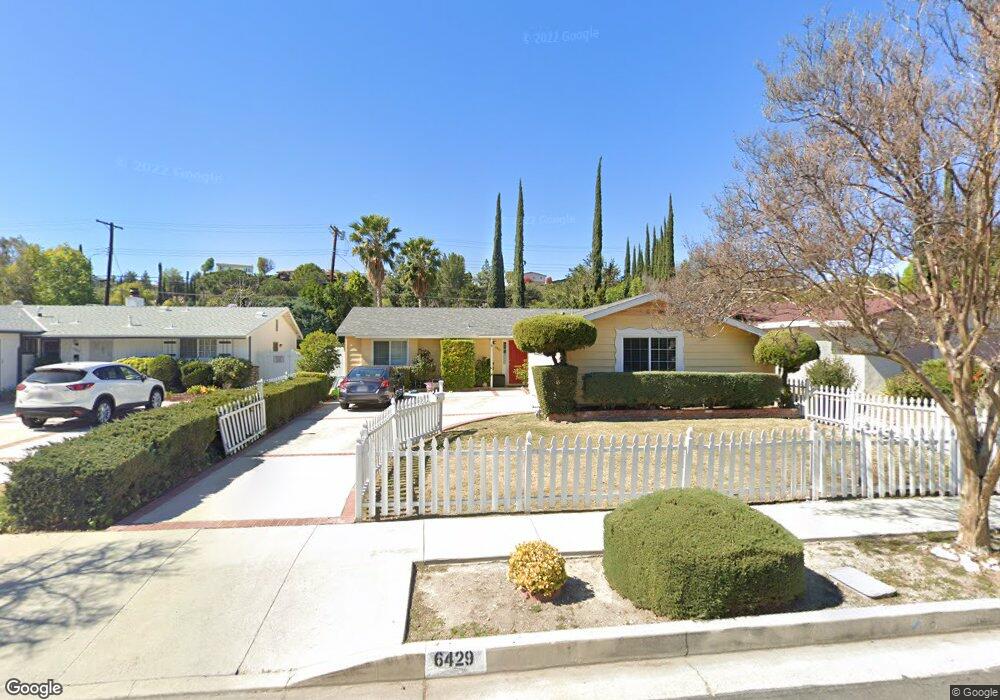
6429 Franrivers Ave West Hills, CA 91307
Canoga Park NeighborhoodEstimated Value: $862,000 - $907,000
3
Beds
3
Baths
1,160
Sq Ft
$768/Sq Ft
Est. Value
About This Home
This home is located at 6429 Franrivers Ave, West Hills, CA 91307 and is currently estimated at $890,624, approximately $767 per square foot. 6429 Franrivers Ave is a home located in Los Angeles County with nearby schools including Haynes Charter For Enriched Studies, Lockhurst Drive Charter Elementary, and Woodlake Elementary Community Charter.
Ownership History
Date
Name
Owned For
Owner Type
Purchase Details
Closed on
Jun 9, 2011
Sold by
Hopkins James Boyd
Bought by
Jacob Roeil and Papazian Silva
Current Estimated Value
Home Financials for this Owner
Home Financials are based on the most recent Mortgage that was taken out on this home.
Original Mortgage
$319,600
Outstanding Balance
$218,976
Interest Rate
4.5%
Mortgage Type
New Conventional
Estimated Equity
$671,648
Purchase Details
Closed on
Apr 8, 2010
Sold by
Hopkins Kenenth Norman
Bought by
Hopkins James Boyd and Hopkins Kenneth Norman
Home Financials for this Owner
Home Financials are based on the most recent Mortgage that was taken out on this home.
Original Mortgage
$23,000
Interest Rate
4.92%
Mortgage Type
Stand Alone Second
Purchase Details
Closed on
Oct 30, 1996
Sold by
Hopkins Norman B
Bought by
Hopkins Norman B and Hopkins Virginia
Create a Home Valuation Report for This Property
The Home Valuation Report is an in-depth analysis detailing your home's value as well as a comparison with similar homes in the area
Home Values in the Area
Average Home Value in this Area
Purchase History
| Date | Buyer | Sale Price | Title Company |
|---|---|---|---|
| Jacob Roeil | $399,500 | Investors Title Company | |
| Hopkins James Boyd | -- | Chicago Title Company | |
| Hopkins Norman B | -- | -- |
Source: Public Records
Mortgage History
| Date | Status | Borrower | Loan Amount |
|---|---|---|---|
| Open | Jacob Roeil | $319,600 | |
| Previous Owner | Hopkins James Boyd | $23,000 |
Source: Public Records
Tax History Compared to Growth
Tax History
| Year | Tax Paid | Tax Assessment Tax Assessment Total Assessment is a certain percentage of the fair market value that is determined by local assessors to be the total taxable value of land and additions on the property. | Land | Improvement |
|---|---|---|---|---|
| 2025 | $6,271 | $501,782 | $355,583 | $146,199 |
| 2024 | $6,271 | $491,944 | $348,611 | $143,333 |
| 2023 | $6,153 | $482,299 | $341,776 | $140,523 |
| 2022 | $5,874 | $472,843 | $335,075 | $137,768 |
| 2021 | $5,802 | $463,572 | $328,505 | $135,067 |
| 2019 | $5,634 | $449,824 | $318,762 | $131,062 |
| 2018 | $5,502 | $441,005 | $312,512 | $128,493 |
| 2016 | $5,258 | $423,882 | $300,378 | $123,504 |
| 2015 | $5,183 | $417,516 | $295,867 | $121,649 |
| 2014 | $5,207 | $409,339 | $290,072 | $119,267 |
Source: Public Records
Map
Nearby Homes
- 24208 Gilmore St
- 24420 Victory Blvd Unit 5
- 24244 Friar St
- 24415 Lemay St
- 6544 Sheltondale Ave
- 6171 Jared Ct
- 24017 Sylvan St
- 24221 Aetna St
- 6703 Corie Ln
- 6153 Debs Ave
- 24224 Welby Way
- 6009 Neddy Ave
- 24686 Wooded Vista
- 6022 Elba Place
- 24417 Clipstone St
- 23928 Archwood St
- 24630 Kittridge St
- 5931 Neddy Ave
- 6129 Rod Ave
- 6416 Kenwater Place
- 6433 Franrivers Ave
- 6425 Franrivers Ave
- 6439 Franrivers Ave
- 6421 Franrivers Ave
- 6426 Valley Circle Blvd
- 6430 Valley Circle Blvd
- 6420 Valley Circle Blvd
- 6436 Valley Circle Blvd
- 6445 Franrivers Ave
- 6428 Franrivers Ave
- 6417 Franrivers Ave
- 6416 Valley Circle Blvd
- 6432 Franrivers Ave
- 6424 Franrivers Ave
- 6442 Valley Circle Blvd
- 6438 Franrivers Ave
- 6420 Franrivers Ave
- 6412 Valley Circle Blvd
- 6451 Franrivers Ave
- 6411 Franrivers Ave