643 Chandler St Worcester, MA 01602
Tatnuck NeighborhoodEstimated Value: $694,428
Studio
1
Bath
2,214
Sq Ft
$314/Sq Ft
Est. Value
About This Home
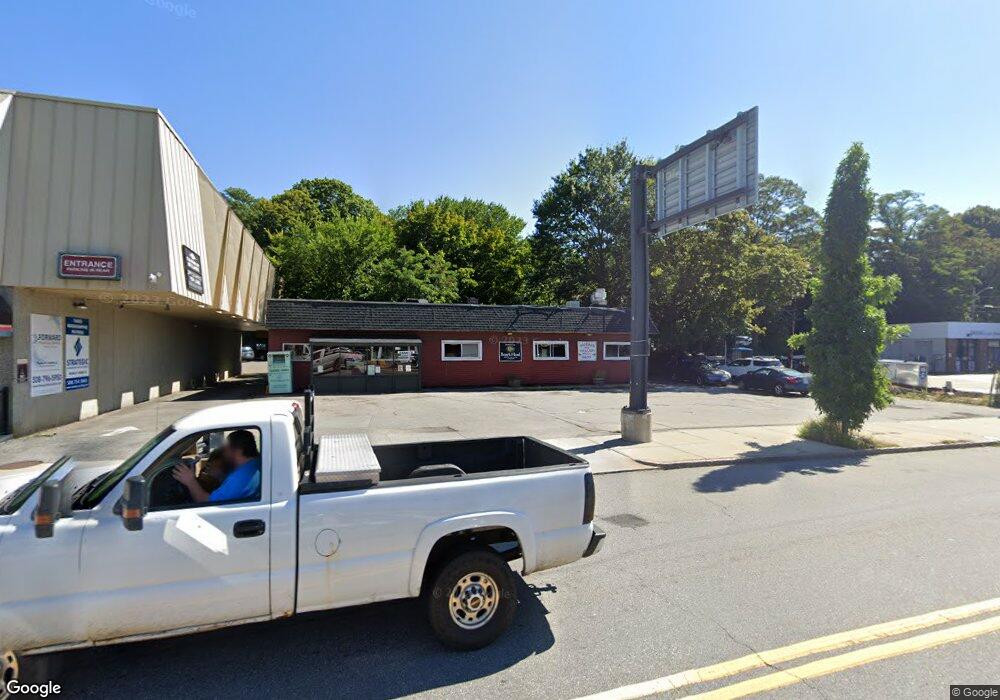
This home is located at 643 Chandler St, Worcester, MA 01602 and is currently estimated at $694,428, approximately $313 per square foot. 643 Chandler St is a home located in Worcester County with nearby schools including Tatnuck Magnet School, Chandler Magnet, and Jacob Hiatt Magnet School.
Ownership History
Date
Name
Owned For
Owner Type
Purchase Details
Closed on
Feb 3, 2023
Sold by
Ambarto Llc
Bought by
Pnj Realty Llc
Current Estimated Value
Home Financials for this Owner
Home Financials are based on the most recent Mortgage that was taken out on this home.
Original Mortgage
$250,000
Outstanding Balance
$241,233
Interest Rate
6.27%
Mortgage Type
Purchase Money Mortgage
Estimated Equity
$453,195
Purchase Details
Closed on
Dec 1, 2005
Sold by
Oliveri Rt and Oliveri
Bought by
Ambarto Llc
Home Financials for this Owner
Home Financials are based on the most recent Mortgage that was taken out on this home.
Original Mortgage
$280,000
Interest Rate
6.14%
Mortgage Type
Commercial
Create a Home Valuation Report for This Property
The Home Valuation Report is an in-depth analysis detailing your home's value as well as a comparison with similar homes in the area
Home Values in the Area
Average Home Value in this Area
Purchase History
| Date | Buyer | Sale Price | Title Company |
|---|---|---|---|
| Pnj Realty Llc | $460,000 | None Available | |
| Ambarto Llc | $350,000 | -- | |
| Ambarto Llc | $350,000 | -- | |
| Ambarto Llc | $350,000 | -- |
Source: Public Records
Mortgage History
| Date | Status | Borrower | Loan Amount |
|---|---|---|---|
| Open | Pnj Realty Llc | $250,000 | |
| Closed | Pnj Realty Llc | $250,000 | |
| Previous Owner | Ambarto Llc | $280,000 |
Source: Public Records
Tax History
| Year | Tax Paid | Tax Assessment Tax Assessment Total Assessment is a certain percentage of the fair market value that is determined by local assessors to be the total taxable value of land and additions on the property. | Land | Improvement |
|---|---|---|---|---|
| 2025 | $10,631 | $371,600 | $185,600 | $186,000 |
| 2024 | $13,761 | $458,100 | $185,600 | $272,500 |
| 2023 | $13,298 | $425,400 | $161,400 | $264,000 |
| 2022 | $14,179 | $425,400 | $161,400 | $264,000 |
| 2021 | $13,904 | $384,100 | $122,700 | $261,400 |
| 2020 | $13,505 | $384,100 | $122,700 | $261,400 |
| 2019 | $12,868 | $368,700 | $122,700 | $246,000 |
| 2018 | $12,023 | $353,300 | $122,700 | $230,600 |
| 2017 | $11,634 | $353,300 | $122,700 | $230,600 |
| 2016 | $11,696 | $344,200 | $119,200 | $225,000 |
| 2015 | $10,921 | $344,200 | $119,200 | $225,000 |
| 2014 | $10,612 | $344,200 | $119,200 | $225,000 |
Source: Public Records
Map
Nearby Homes
- 23 Tiverton Pkwy
- 12 Cardinal Rd
- 122 Copperfield Rd
- 118 Beaconsfield Rd
- 47R Yarnie Unit 3A
- 47R Yarnie Unit 1B
- 47R Yarnie Unit 2B
- 47R Yarnie Unit 4B
- 47R Yarnie Unit 8B
- 47R Yarnie Unit 5A
- 47R Yarnie Unit 6B
- 47R Yarnie Unit 4A
- 47R Yarnie Unit 1A
- 47R Yarnie Unit 9
- 47R Yarnie Unit 8A
- 47R Yarnie Unit 6A
- 47R Yarnie Unit 7A
- 47R Yarnie Unit 5B
- 47R Yarnie Unit 2A
- 47R Yarnie Unit 7B
- 645 Chandler St Unit 1
- 645 Chandler St Unit 6
- 645 Chandler St Unit 2nd flr
- 645 Chandler St Unit 5
- 645 Chandler St
- 647 Chandler St
- 649 Chandler St
- 617 Mill St Unit 1
- 617 Mill St Unit 2A
- 617 Mill St
- 644 Chandler St
- 1108 Pleasant St
- 623 Mill St
- 1106 Pleasant St Unit 2
- 1104 Pleasant St Unit 2
- 1104 Pleasant St
- 1124 Pleasant St
- 1 Mower St
- 625 Mill St
- 618 Mill St
Your Personal Tour Guide
Ask me questions while you tour the home.