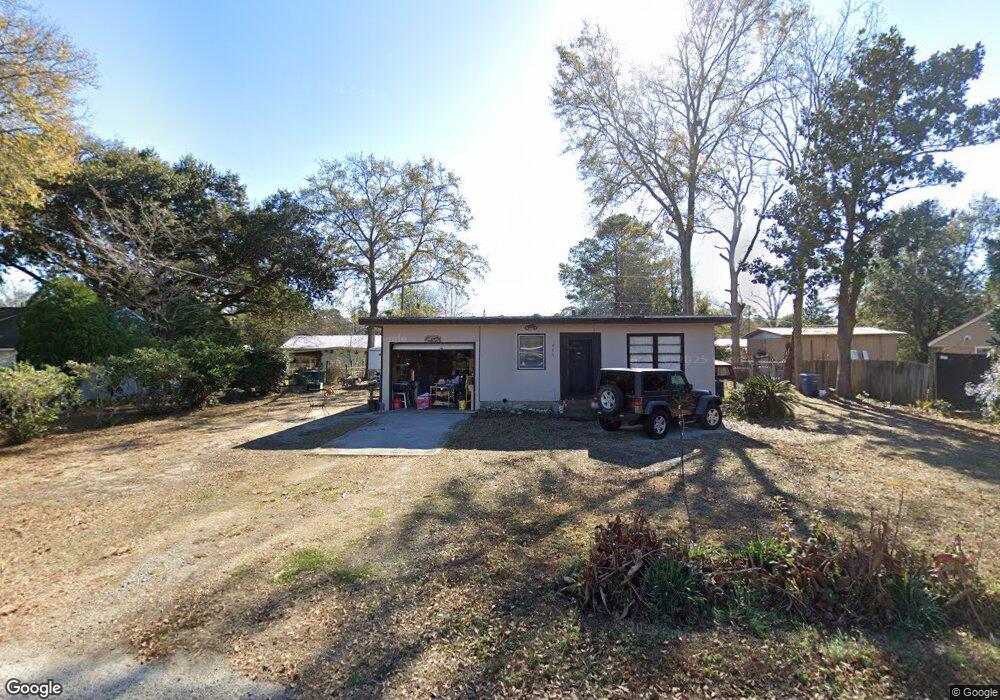
643 Moore St Myrtle Beach, SC 29577
Downtown Myrtle Beach NeighborhoodEstimated Value: $189,953 - $224,000
3
Beds
2
Baths
1,199
Sq Ft
$168/Sq Ft
Est. Value
About This Home
This home is located at 643 Moore St, Myrtle Beach, SC 29577 and is currently estimated at $201,238, approximately $167 per square foot. 643 Moore St is a home located in Horry County with nearby schools including Myrtle Beach Child Development Center, Myrtle Beach Primary School, and Myrtle Beach Middle School.
Ownership History
Date
Name
Owned For
Owner Type
Purchase Details
Closed on
Feb 27, 2002
Sold by
Crow David Samuel
Bought by
Herschberger Christopher G and Lambert Leslie Wendy
Current Estimated Value
Home Financials for this Owner
Home Financials are based on the most recent Mortgage that was taken out on this home.
Original Mortgage
$73,625
Outstanding Balance
$29,009
Interest Rate
6.98%
Mortgage Type
Purchase Money Mortgage
Estimated Equity
$172,229
Purchase Details
Closed on
Mar 4, 2001
Sold by
Crow David Samuel and Crow David S
Bought by
Crow David S and Crow Ronald E
Create a Home Valuation Report for This Property
The Home Valuation Report is an in-depth analysis detailing your home's value as well as a comparison with similar homes in the area
Home Values in the Area
Average Home Value in this Area
Purchase History
| Date | Buyer | Sale Price | Title Company |
|---|---|---|---|
| Herschberger Christopher G | $77,500 | -- | |
| Crow David S | -- | -- |
Source: Public Records
Mortgage History
| Date | Status | Borrower | Loan Amount |
|---|---|---|---|
| Open | Herschberger Christopher G | $73,625 |
Source: Public Records
Tax History
| Year | Tax Paid | Tax Assessment Tax Assessment Total Assessment is a certain percentage of the fair market value that is determined by local assessors to be the total taxable value of land and additions on the property. | Land | Improvement |
|---|---|---|---|---|
| 2025 | $244 | $0 | $0 | $0 |
| 2024 | $244 | $6,373 | $3,036 | $3,337 |
| 2023 | $422 | $4,109 | $1,018 | $3,091 |
| 2021 | $379 | $4,474 | $1,026 | $3,448 |
| 2020 | $327 | $4,474 | $1,026 | $3,448 |
| 2019 | $315 | $4,474 | $1,026 | $3,448 |
| 2018 | $280 | $3,574 | $886 | $2,688 |
| 2017 | $273 | $3,574 | $886 | $2,688 |
| 2016 | -- | $3,574 | $886 | $2,688 |
| 2015 | $270 | $3,574 | $886 | $2,688 |
| 2014 | $243 | $3,574 | $886 | $2,688 |
Source: Public Records
Map
Nearby Homes
- 1636 Stuart Square Cir
- 1105 Highway 15
- 1719 Low Country Place Unit B
- 978 Periwinkle Place
- 128 Hoffman Park Dr
- 128 Hoffman Park Dr Unit 3
- 1047 Pinwheel Loop Unit Parkview, 1047 Pinwh
- 1208 Pinegrove Dr Unit D
- 1208 Pinegrove Dr Unit G
- 1208 Pinegrove Dr Unit H
- 1210 Pinegrove Dr Unit G
- 1065 Pinwheel Loop
- 1129 9th Ave S
- 935 Southpark Dr
- 944 Pine Thicket St
- 1207 Pinegrove Dr Unit C
- 1207 Pinegrove Dr Unit B
- 1207 Pinegrove Dr Unit D
- 1207 Pinegrove Dr
- 1022 Pinnacle Ln
- 651 Moore St
- 635 Moore St Unit MB
- 652 Martin St
- 662 Martin St
- 644 Martin St
- 627 Moore St
- 638 Moore St
- 646 Moore St
- 1162 Pine Island Rd
- 630 Moore St
- 1154 Pine Island Rd
- 636 Martin St
- 606 Martin St
- 1148 Pine Island Rd
- 1174 Pine Island Rd
- 622 Moore St Unit MB
- 1182 Pine Island Rd
- 657 Martin St
- 649 Martin St
- 629 King Dr
Your Personal Tour Guide
Ask me questions while you tour the home.