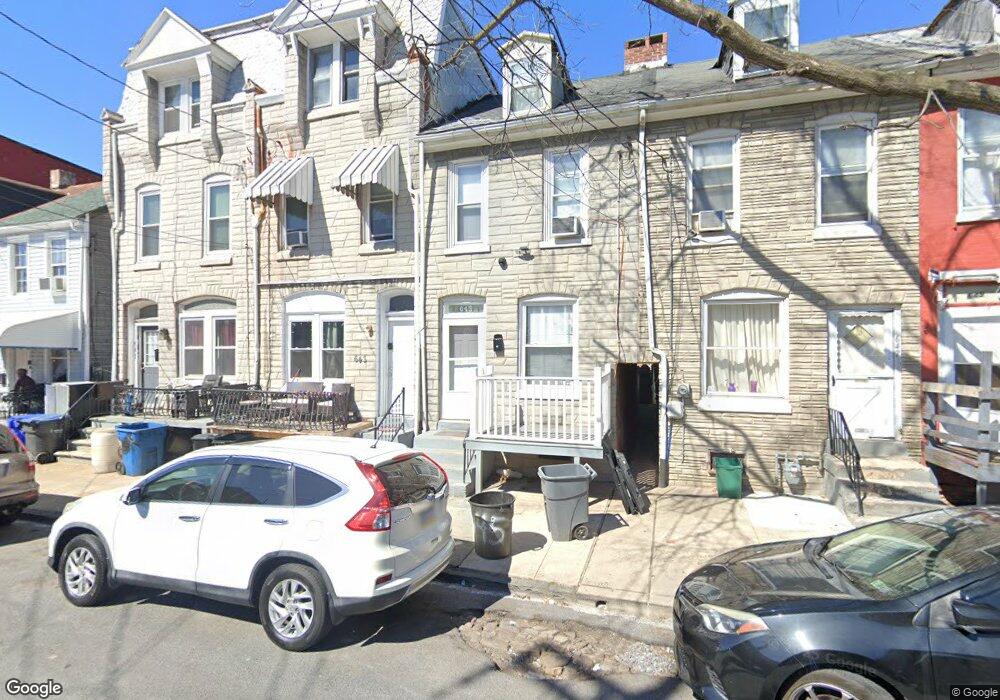
643 Pine St Reading, PA 19602
Estimated Value: $135,874 - $176,000
5
Beds
1
Bath
1,388
Sq Ft
$116/Sq Ft
Est. Value
About This Home
This home is located at 643 Pine St, Reading, PA 19602 and is currently estimated at $161,469, approximately $116 per square foot. 643 Pine St is a home located in Berks County with nearby schools including Tyson-Schoener Elementary School, Reading Senior High School, and St. Peter School.
Ownership History
Date
Name
Owned For
Owner Type
Purchase Details
Closed on
Sep 16, 2024
Sold by
Conner Brian J
Bought by
Labissiere Malcolm and Santana Suzette
Current Estimated Value
Home Financials for this Owner
Home Financials are based on the most recent Mortgage that was taken out on this home.
Original Mortgage
$126,400
Outstanding Balance
$124,976
Interest Rate
6.46%
Mortgage Type
New Conventional
Estimated Equity
$36,493
Purchase Details
Closed on
Sep 12, 2011
Sold by
Conner Brian and Conner Jenifer
Bought by
Conner Brian J
Purchase Details
Closed on
Apr 15, 2009
Sold by
Stone Genesis F
Bought by
Conner Brian J and Conner Jenifer L
Purchase Details
Closed on
Mar 20, 2002
Sold by
Allison Tonya
Bought by
Stone Genesis F
Create a Home Valuation Report for This Property
The Home Valuation Report is an in-depth analysis detailing your home's value as well as a comparison with similar homes in the area
Home Values in the Area
Average Home Value in this Area
Purchase History
| Date | Buyer | Sale Price | Title Company |
|---|---|---|---|
| Labissiere Malcolm | $158,000 | None Listed On Document | |
| Conner Brian J | -- | None Available | |
| Conner Brian J | $120,500 | None Available | |
| Stone Genesis F | $11,500 | -- |
Source: Public Records
Mortgage History
| Date | Status | Borrower | Loan Amount |
|---|---|---|---|
| Open | Labissiere Malcolm | $126,400 |
Source: Public Records
Tax History
| Year | Tax Paid | Tax Assessment Tax Assessment Total Assessment is a certain percentage of the fair market value that is determined by local assessors to be the total taxable value of land and additions on the property. | Land | Improvement |
|---|---|---|---|---|
| 2025 | $554 | $20,400 | $5,000 | $15,400 |
| 2024 | $906 | $20,400 | $5,000 | $15,400 |
| 2023 | $892 | $20,400 | $5,000 | $15,400 |
| 2022 | $892 | $20,400 | $5,000 | $15,400 |
| 2021 | $892 | $20,400 | $5,000 | $15,400 |
| 2020 | $883 | $20,400 | $5,000 | $15,400 |
| 2019 | $883 | $20,400 | $5,000 | $15,400 |
| 2018 | $883 | $20,400 | $5,000 | $15,400 |
| 2017 | $877 | $20,400 | $5,000 | $15,400 |
Source: Public Records
Map
Nearby Homes
Your Personal Tour Guide
Ask me questions while you tour the home.