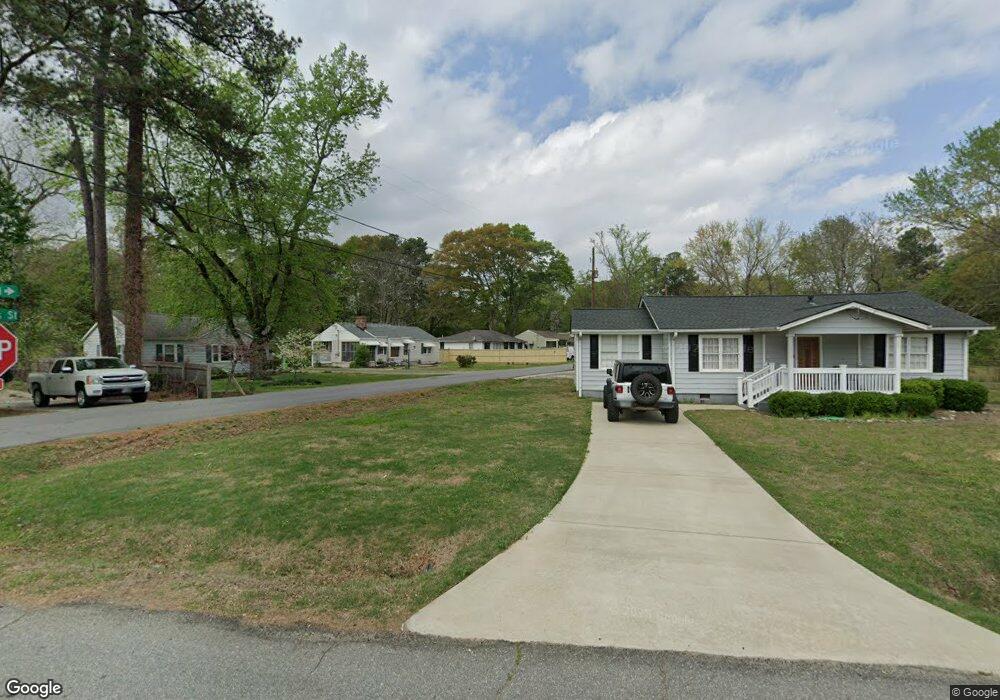
643 Taylor Dr SE Smyrna, GA 30080
Estimated Value: $252,000 - $351,000
3
Beds
1
Bath
1,480
Sq Ft
$205/Sq Ft
Est. Value
About This Home
This home is located at 643 Taylor Dr SE, Smyrna, GA 30080 and is currently estimated at $303,997, approximately $205 per square foot. 643 Taylor Dr SE is a home located in Cobb County with nearby schools including Green Acres Elementary School, Campbell High School, and International Academy of Smyrna.
Ownership History
Date
Name
Owned For
Owner Type
Purchase Details
Closed on
May 14, 2024
Sold by
All Visions Inc
Bought by
Willis Latavious and Willis Lateshia
Current Estimated Value
Home Financials for this Owner
Home Financials are based on the most recent Mortgage that was taken out on this home.
Original Mortgage
$373,117
Outstanding Balance
$367,478
Interest Rate
6.82%
Mortgage Type
FHA
Estimated Equity
-$63,481
Purchase Details
Closed on
May 24, 2022
Sold by
Graves Donavan R
Bought by
All Visions Inc
Home Financials for this Owner
Home Financials are based on the most recent Mortgage that was taken out on this home.
Original Mortgage
$274,400
Interest Rate
4.43%
Mortgage Type
Construction
Purchase Details
Closed on
Aug 7, 2002
Sold by
Hipp Dorothy L
Bought by
Graves Donavan R and Graves Elizabeth R
Home Financials for this Owner
Home Financials are based on the most recent Mortgage that was taken out on this home.
Original Mortgage
$111,254
Interest Rate
6.53%
Mortgage Type
FHA
Create a Home Valuation Report for This Property
The Home Valuation Report is an in-depth analysis detailing your home's value as well as a comparison with similar homes in the area
Home Values in the Area
Average Home Value in this Area
Purchase History
| Date | Buyer | Sale Price | Title Company |
|---|---|---|---|
| Willis Latavious | $380,000 | None Listed On Document | |
| All Visions Inc | $250,000 | Weissman Pc | |
| Graves Donavan R | $113,000 | -- |
Source: Public Records
Mortgage History
| Date | Status | Borrower | Loan Amount |
|---|---|---|---|
| Open | Willis Latavious | $373,117 | |
| Previous Owner | All Visions Inc | $274,400 | |
| Previous Owner | Graves Donavan R | $111,254 |
Source: Public Records
Tax History Compared to Growth
Tax History
| Year | Tax Paid | Tax Assessment Tax Assessment Total Assessment is a certain percentage of the fair market value that is determined by local assessors to be the total taxable value of land and additions on the property. | Land | Improvement |
|---|---|---|---|---|
| 2025 | $4,022 | $133,492 | $28,000 | $105,492 |
| 2024 | $2,963 | $98,268 | $26,000 | $72,268 |
| 2023 | $2,963 | $98,268 | $26,000 | $72,268 |
| 2022 | $2,126 | $98,268 | $26,000 | $72,268 |
| 2021 | $1,325 | $61,688 | $28,000 | $33,688 |
| 2020 | $1,282 | $59,688 | $26,000 | $33,688 |
| 2019 | $1,433 | $66,612 | $18,000 | $48,612 |
| 2018 | $629 | $29,884 | $8,000 | $21,884 |
| 2017 | $450 | $24,576 | $8,000 | $16,576 |
| 2016 | $319 | $19,972 | $4,800 | $15,172 |
| 2015 | $328 | $19,972 | $4,800 | $15,172 |
| 2014 | $331 | $19,972 | $0 | $0 |
Source: Public Records
Map
Nearby Homes
- 753 Taylor Dr SE
- 731 Mozley Dr SE
- 1670 Concord Dr SE
- 638 Medford Place SE
- 1948 Benson Ave SE
- 2039 Gober Ave SE
- 2046 Harold Ave SE
- 419 McInnes Cir
- 1858 Belmore St SE
- 7004 Pat Mell Place SE
- 2185 Trailwood Dr SE
- 846 Mell Ct SE
- 690 Green Acres Rd SE
- 2145 Valley Oaks Dr SE
- 2178 Elizabeth Ave SE
- 2275 Old Spring Rd SE
- 651 Taylor Dr SE
- 713 Taylor Dr SE
- 733 Taylor Dr SE
- 703 Taylor Dr SE
- 743 Taylor Dr SE
- 621 Taylor Dr SE
- 722 Taylor Dr SE
- 732 Taylor Dr SE
- 630 Taylor Dr SE
- 667 Taylor Dr SE
- 691 Taylor Dr SE
- 660 Taylor Dr SE
- 702 Taylor Dr SE
- 1765 Darwin Rd SE
- 742 Taylor Dr SE
- 681 Taylor Dr SE
- 763 Taylor Dr SE
- 1739 Darwin Rd SE
- 752 Taylor Dr SE
- 690 Taylor Dr SE