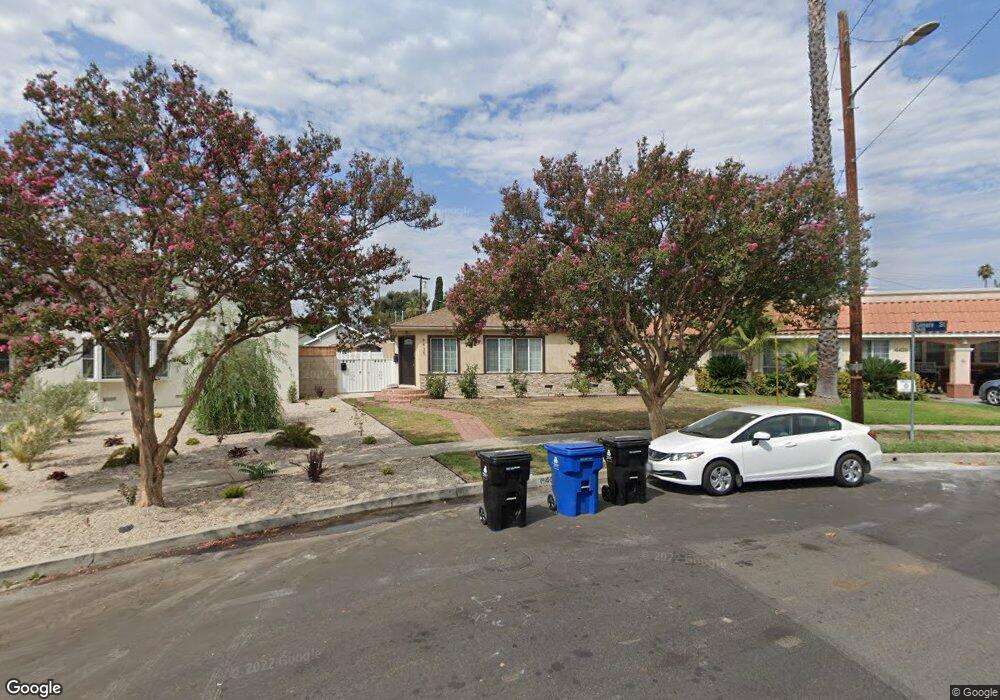
6435 Capps Ave Reseda, CA 91335
Estimated Value: $896,000 - $1,132,000
7
Beds
5
Baths
3,111
Sq Ft
$323/Sq Ft
Est. Value
About This Home
This home is located at 6435 Capps Ave, Reseda, CA 91335 and is currently estimated at $1,006,000, approximately $323 per square foot. 6435 Capps Ave is a home located in Los Angeles County with nearby schools including Vanalden Avenue Elementary, Gaspar De Portola Middle School, and Reseda High School.
Ownership History
Date
Name
Owned For
Owner Type
Purchase Details
Closed on
Feb 23, 2006
Sold by
Koshkarian Narsis and Koshkarian Noyemi
Bought by
Koshkarian Narsis and Koshkarian Noyemi
Current Estimated Value
Home Financials for this Owner
Home Financials are based on the most recent Mortgage that was taken out on this home.
Original Mortgage
$100,000
Outstanding Balance
$55,761
Interest Rate
6.04%
Mortgage Type
Credit Line Revolving
Estimated Equity
$950,239
Purchase Details
Closed on
Jun 30, 1993
Sold by
Flaherty Robert C and Flaherty Jacqueline N
Bought by
Koshkarian Nerses and Koshkarian Noyemi
Home Financials for this Owner
Home Financials are based on the most recent Mortgage that was taken out on this home.
Original Mortgage
$136,000
Interest Rate
7.2%
Create a Home Valuation Report for This Property
The Home Valuation Report is an in-depth analysis detailing your home's value as well as a comparison with similar homes in the area
Home Values in the Area
Average Home Value in this Area
Purchase History
| Date | Buyer | Sale Price | Title Company |
|---|---|---|---|
| Koshkarian Narsis | -- | Accommodation | |
| Koshkarian Nerses | $170,000 | First American Title Co Of L |
Source: Public Records
Mortgage History
| Date | Status | Borrower | Loan Amount |
|---|---|---|---|
| Open | Koshkarian Narsis | $100,000 | |
| Previous Owner | Koshkarian Nerses | $136,000 |
Source: Public Records
Tax History
| Year | Tax Paid | Tax Assessment Tax Assessment Total Assessment is a certain percentage of the fair market value that is determined by local assessors to be the total taxable value of land and additions on the property. | Land | Improvement |
|---|---|---|---|---|
| 2025 | $5,781 | $454,225 | $190,176 | $264,049 |
| 2024 | $5,781 | $445,320 | $186,448 | $258,872 |
| 2023 | $5,675 | $436,590 | $182,793 | $253,797 |
| 2022 | $5,420 | $428,030 | $179,209 | $248,821 |
| 2021 | $5,339 | $419,639 | $175,696 | $243,943 |
| 2019 | $3,358 | $258,995 | $170,486 | $88,509 |
| 2018 | $3,263 | $253,918 | $167,144 | $86,774 |
| 2016 | $3,103 | $244,059 | $160,654 | $83,405 |
| 2015 | $3,060 | $240,394 | $158,241 | $82,153 |
| 2014 | $3,080 | $235,686 | $155,142 | $80,544 |
Source: Public Records
Map
Nearby Homes
- 6355 Yolanda Ave
- 6323 Reseda Blvd Unit 6
- 6323 Reseda Blvd Unit 13
- 6545 Reseda Blvd Unit 3
- 6637 Capps Ave
- 6447 Wilbur Ave
- 18928 Victory Blvd
- 6545 Wilbur Ave Unit 39
- 6704 Rhea Ave
- 6714 Amigo Ave
- 18931 Kittridge St Unit 73
- 6653 Darby Ave
- 6511 Wystone Ave Unit 4
- 6521 Wystone Ave Unit 3
- 19021 Erwin St
- 6632 Darby Ave
- 19040 Friar St
- 6640 Darby Ave
- 6652 Darby Ave
- 19041 Hamlin St Unit 5
- 6433 Capps Ave
- 6431 Capps Ave
- 6439 Capps Ave
- 6422 Yolanda Ave
- 6416 Yolanda Ave
- 18618 Gilmore St
- 6430 Yolanda Ave
- 6445 Capps Ave
- 18633 Victory Blvd
- 6436 Yolanda Ave
- 18612 Gilmore St
- 18627 Victory Blvd
- 18639 Victory Blvd
- 6440 Capps Ave
- 18621 Victory Blvd Unit 1
- 18621 Victory Blvd
- 18645 Victory Blvd
- 18617 Gilmore St
- 6442 Yolanda Ave
- 6451 Capps Ave
Your Personal Tour Guide
Ask me questions while you tour the home.