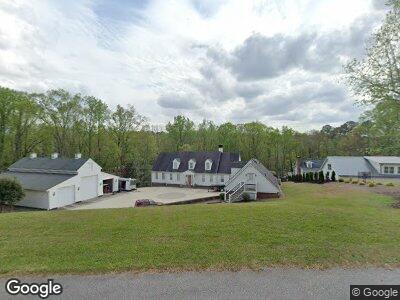
6435 Trudy Dr Flowery Branch, GA 30542
Estimated Value: $1,249,000 - $1,463,000
4
Beds
7
Baths
5,099
Sq Ft
$267/Sq Ft
Est. Value
About This Home
This home is located at 6435 Trudy Dr, Flowery Branch, GA 30542 and is currently estimated at $1,363,497, approximately $267 per square foot. 6435 Trudy Dr is a home located in Hall County with nearby schools including Flowery Branch Elementary School, West Hall Middle School, and West Hall High School.
Ownership History
Date
Name
Owned For
Owner Type
Purchase Details
Closed on
May 12, 2022
Sold by
Granger Stede W
Bought by
Granger Stede William and Stede & Sheryl Granger Rev Tr
Current Estimated Value
Purchase Details
Closed on
Jan 22, 2004
Sold by
Taylor Willene
Bought by
Granger Stede W and Granger Sheryl
Purchase Details
Closed on
Jun 20, 1994
Sold by
Bostwick Gregory Lee
Bought by
Bostwick Monty S
Purchase Details
Closed on
Apr 29, 1993
Sold by
Parsonnet Diane S
Bought by
Taylor Willene
Create a Home Valuation Report for This Property
The Home Valuation Report is an in-depth analysis detailing your home's value as well as a comparison with similar homes in the area
Home Values in the Area
Average Home Value in this Area
Purchase History
| Date | Buyer | Sale Price | Title Company |
|---|---|---|---|
| Granger Stede William | -- | -- | |
| Granger Stede William | -- | -- | |
| Granger Stede W | $110,000 | -- | |
| Bostwick Monty S | $40,000 | -- | |
| Taylor Willene | $24,000 | -- |
Source: Public Records
Mortgage History
| Date | Status | Borrower | Loan Amount |
|---|---|---|---|
| Previous Owner | Granger Stede W | $370,000 | |
| Previous Owner | Granger Stede W | $748,000 | |
| Previous Owner | Granger Stede W | $700,000 | |
| Previous Owner | Granger Stede W | $100,000 | |
| Previous Owner | Granger Stede W | $275,000 | |
| Previous Owner | Granger Stede | $250,000 | |
| Previous Owner | Granger Stede W | $450,000 | |
| Previous Owner | Clark Larry H | $133,569 | |
| Closed | Taylor Willene | -- |
Source: Public Records
Tax History Compared to Growth
Tax History
| Year | Tax Paid | Tax Assessment Tax Assessment Total Assessment is a certain percentage of the fair market value that is determined by local assessors to be the total taxable value of land and additions on the property. | Land | Improvement |
|---|---|---|---|---|
| 2024 | $3,873 | $475,024 | $123,600 | $351,424 |
| 2023 | $3,643 | $459,924 | $123,600 | $336,324 |
| 2022 | $9,424 | $365,396 | $74,320 | $291,076 |
| 2021 | $9,869 | $375,636 | $74,320 | $301,316 |
| 2020 | $9,901 | $366,036 | $74,320 | $291,716 |
| 2019 | $9,816 | $359,636 | $74,320 | $285,316 |
| 2018 | $9,602 | $340,436 | $63,000 | $277,436 |
| 2017 | $8,728 | $312,716 | $45,360 | $267,356 |
| 2016 | $8,516 | $312,716 | $45,360 | $267,356 |
| 2015 | $7,531 | $312,716 | $45,360 | $267,356 |
| 2014 | $7,531 | $358,076 | $90,720 | $267,356 |
Source: Public Records
Map
Nearby Homes
- 6351 Spring Cove Dr
- 6409 Lights Ferry Rd
- 5922 Terrace Lake Point
- 5993 Overby Rd
- 5760 Blossom Brook Ct
- 6061 Overby Rd
- 6212 Germantown Dr
- 6560 Crestwood Peninsula
- 6084 Lights Ferry Rd
- 5963 Nachoochee Trail
- 5972 McEver Rd
- 5614 Mohave Ct
- 6005 Bateau Dr
- 6030 Seminole Dr
- 5972 Warpath Rd
- 5669 Whistling Sparrow Ln
- 5843 Meadow View Ln