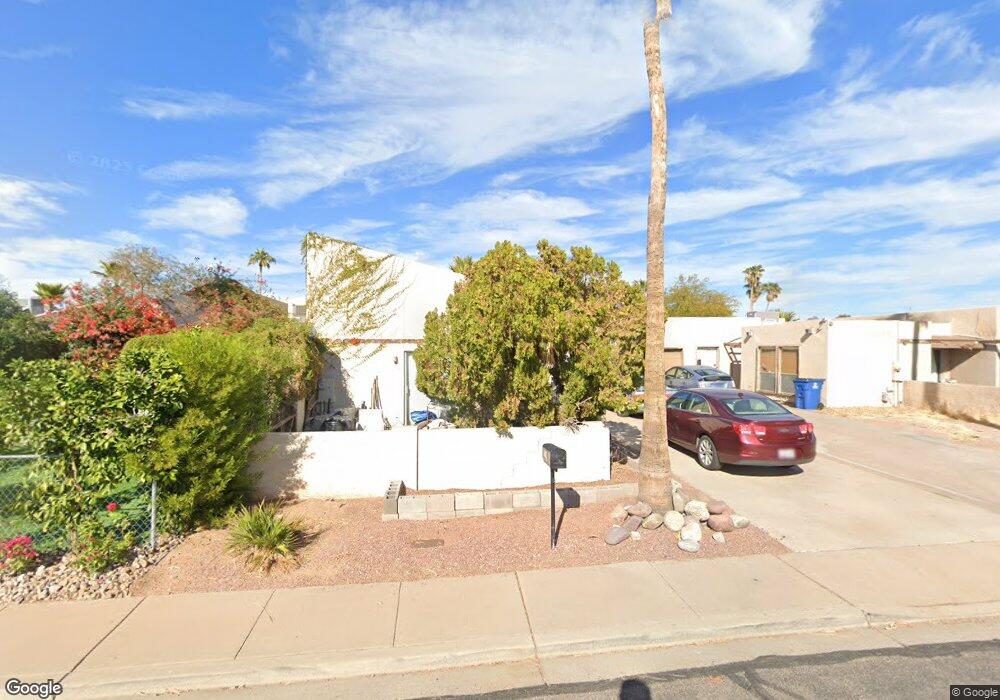
6436 E Casper Rd Mesa, AZ 85205
Central Mesa East NeighborhoodEstimated Value: $260,959 - $305,000
2
Beds
2
Baths
1,114
Sq Ft
$253/Sq Ft
Est. Value
About This Home
This home is located at 6436 E Casper Rd, Mesa, AZ 85205 and is currently estimated at $281,740, approximately $252 per square foot. 6436 E Casper Rd is a home located in Maricopa County with nearby schools including Salk Elementary School, Franklin at Brimhall Elementary School, and Franklin West Elementary School.
Ownership History
Date
Name
Owned For
Owner Type
Purchase Details
Closed on
Mar 12, 2009
Sold by
Checkley James W and Checkley Sandra L
Bought by
Checkley James and Checkley Sandra L
Current Estimated Value
Purchase Details
Closed on
Mar 21, 1997
Sold by
Checkley Tina Lynn
Bought by
Checkley James W and Checkley Sandra L
Home Financials for this Owner
Home Financials are based on the most recent Mortgage that was taken out on this home.
Original Mortgage
$52,000
Outstanding Balance
$6,205
Interest Rate
7.56%
Estimated Equity
$275,535
Purchase Details
Closed on
Jan 20, 1997
Sold by
Miller Travis W
Bought by
Checkley Tina Lynn
Home Financials for this Owner
Home Financials are based on the most recent Mortgage that was taken out on this home.
Original Mortgage
$52,000
Outstanding Balance
$6,205
Interest Rate
7.56%
Estimated Equity
$275,535
Purchase Details
Closed on
Jul 3, 1995
Sold by
Chesney Robert J and Eleanor Chesney L
Bought by
Miller Travis W
Home Financials for this Owner
Home Financials are based on the most recent Mortgage that was taken out on this home.
Original Mortgage
$48,722
Interest Rate
7.71%
Mortgage Type
FHA
Create a Home Valuation Report for This Property
The Home Valuation Report is an in-depth analysis detailing your home's value as well as a comparison with similar homes in the area
Home Values in the Area
Average Home Value in this Area
Purchase History
| Date | Buyer | Sale Price | Title Company |
|---|---|---|---|
| Checkley James | -- | None Available | |
| Checkley James W | -- | Fiesta Title & Escrow Agency | |
| Checkley Tina Lynn | -- | Fiesta Title & Escrow Agency | |
| Miller Travis W | $48,000 | United Title Agency |
Source: Public Records
Mortgage History
| Date | Status | Borrower | Loan Amount |
|---|---|---|---|
| Open | Checkley James W | $52,000 | |
| Previous Owner | Miller Travis W | $48,722 |
Source: Public Records
Tax History
| Year | Tax Paid | Tax Assessment Tax Assessment Total Assessment is a certain percentage of the fair market value that is determined by local assessors to be the total taxable value of land and additions on the property. | Land | Improvement |
|---|---|---|---|---|
| 2025 | $534 | $5,926 | -- | -- |
| 2024 | $541 | $5,644 | -- | -- |
| 2023 | $541 | $19,670 | $3,930 | $15,740 |
| 2022 | $528 | $15,820 | $3,160 | $12,660 |
| 2021 | $527 | $14,230 | $2,840 | $11,390 |
| 2020 | $523 | $12,870 | $2,570 | $10,300 |
| 2019 | $484 | $11,450 | $2,290 | $9,160 |
| 2018 | $472 | $10,110 | $2,020 | $8,090 |
| 2017 | $456 | $8,710 | $1,740 | $6,970 |
| 2016 | $446 | $8,430 | $1,680 | $6,750 |
| 2015 | $417 | $5,570 | $1,110 | $4,460 |
Source: Public Records
Map
Nearby Homes
- 6449 E Des Moines St
- 6454 E University Dr Unit 8
- 6256 E Decatur St
- 6610 E University Dr Unit 111
- 650 N 65th Way
- 310 N 65th St Unit 1
- 6332 E Billings St
- 6252 E Billings St Unit 2
- 6449 E Adobe Rd
- 6710 E University Dr Unit 118
- 6544 E Dodge St
- 6149 E Decatur St
- 6218 E Dodge St
- 649 N 61st Place
- 6522 E Adobe Rd
- 6117 E Decatur St
- 6646 E Dodge St
- 635 N 67th Place
- 6660 E Dodge St
- 6231 E Ellis St
- 6428 E Casper Rd
- 6444 E Casper Rd
- 6420 E Casper Rd
- 6452 E Casper Rd
- 6433 E Colby St
- 6425 E Colby St
- 6412 E Casper Rd
- 6417 E Colby St
- 6449 E Colby St
- 6435 E Casper Rd
- 6409 E Colby St
- 6404 E Casper Rd
- 6443 E Casper Rd
- 6427 Casper Rd
- 6419 Casper Rd
- 6451 E Casper Rd
- 6401 E Colby St
- 6411 E Casper Rd
- 6403 E Casper Rd
- 6438 E Covina Rd
Your Personal Tour Guide
Ask me questions while you tour the home.