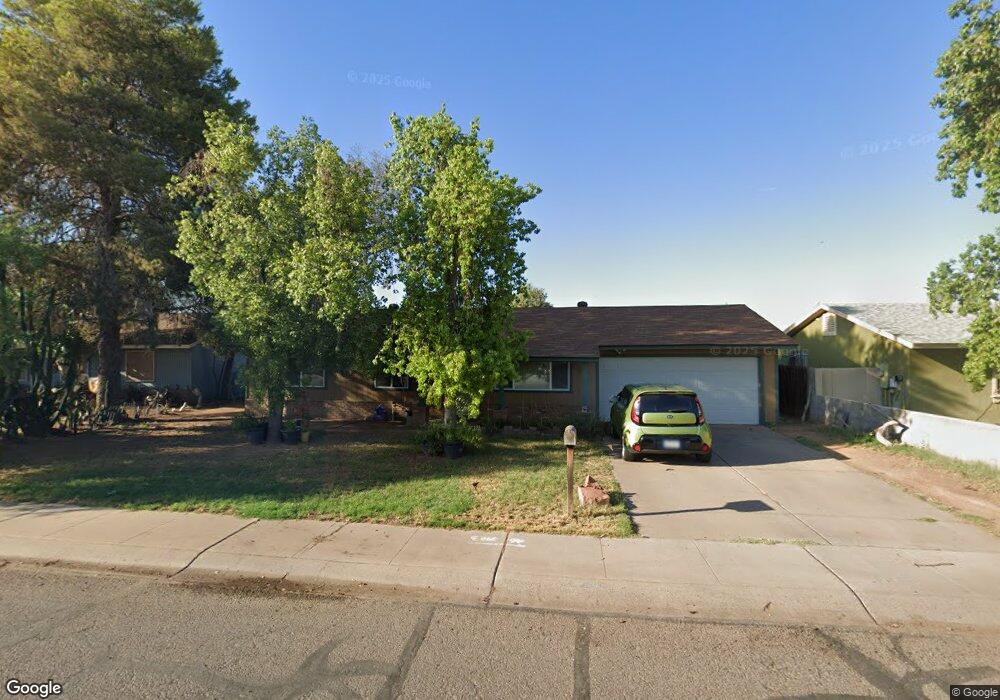
6437 W Mckinley St Phoenix, AZ 85043
Estrella Village NeighborhoodEstimated Value: $296,782 - $416,000
--
Bed
2
Baths
1,040
Sq Ft
$334/Sq Ft
Est. Value
About This Home
This home is located at 6437 W Mckinley St, Phoenix, AZ 85043 and is currently estimated at $347,196, approximately $333 per square foot. 6437 W Mckinley St is a home located in Maricopa County with nearby schools including Sunridge Elementary School, Santa Maria Middle School, and Sierra Linda High School.
Ownership History
Date
Name
Owned For
Owner Type
Purchase Details
Closed on
Jun 21, 2001
Sold by
Geiger Jack
Bought by
Geiger Jack and Prosser Sommer
Current Estimated Value
Purchase Details
Closed on
Apr 14, 2001
Sold by
Bell Carol A
Bought by
Geiger Jack
Home Financials for this Owner
Home Financials are based on the most recent Mortgage that was taken out on this home.
Original Mortgage
$77,400
Outstanding Balance
$28,256
Interest Rate
6.89%
Mortgage Type
New Conventional
Estimated Equity
$318,940
Purchase Details
Closed on
Sep 16, 1996
Sold by
Bell Robert R and Bell Carol A
Bought by
Bell Robert R and Bell Carol A
Purchase Details
Closed on
Oct 12, 1995
Sold by
Martin Billie J and Martin Marjorie E
Bought by
Bell Robert Ross and Bell Carol Ann
Home Financials for this Owner
Home Financials are based on the most recent Mortgage that was taken out on this home.
Original Mortgage
$81,953
Interest Rate
7.42%
Mortgage Type
FHA
Create a Home Valuation Report for This Property
The Home Valuation Report is an in-depth analysis detailing your home's value as well as a comparison with similar homes in the area
Home Values in the Area
Average Home Value in this Area
Purchase History
| Date | Buyer | Sale Price | Title Company |
|---|---|---|---|
| Geiger Jack | -- | Chicago Title Insurance Comp | |
| Geiger Jack | $96,800 | Chicago Title Insurance Co | |
| Bell Robert R | -- | -- | |
| Bell Robert Ross | $82,500 | Fidelity Title |
Source: Public Records
Mortgage History
| Date | Status | Borrower | Loan Amount |
|---|---|---|---|
| Open | Geiger Jack | $77,400 | |
| Previous Owner | Bell Robert Ross | $81,953 |
Source: Public Records
Tax History Compared to Growth
Tax History
| Year | Tax Paid | Tax Assessment Tax Assessment Total Assessment is a certain percentage of the fair market value that is determined by local assessors to be the total taxable value of land and additions on the property. | Land | Improvement |
|---|---|---|---|---|
| 2025 | $1,662 | $13,392 | -- | -- |
| 2024 | $1,475 | $12,755 | -- | -- |
| 2023 | $1,475 | $29,380 | $5,870 | $23,510 |
| 2022 | $1,435 | $21,180 | $4,230 | $16,950 |
| 2021 | $1,359 | $19,550 | $3,910 | $15,640 |
| 2020 | $1,311 | $16,930 | $3,380 | $13,550 |
| 2019 | $1,296 | $13,880 | $2,770 | $11,110 |
| 2018 | $728 | $11,580 | $2,310 | $9,270 |
| 2017 | $683 | $8,580 | $1,710 | $6,870 |
| 2016 | $674 | $7,780 | $1,550 | $6,230 |
| 2015 | $603 | $7,720 | $1,540 | $6,180 |
Source: Public Records
Map
Nearby Homes
- 6420 W Van Buren St Unit B4
- 6614 W Polk St
- 518 N 66th Ln
- 6629 W Polk St
- 410 N 67th Ln
- 500 N 67th Ave Unit 194
- 500 N 67th Ave Unit 203
- 500 N 67th Ave Unit 88
- 500 N 67th Ave Unit 198
- 500 N 67th Ave Unit 69
- 500 N 67th Ave Unit 225
- 6810 W Mckinley St
- 6812 W Polk St Unit 223
- 6828 W Pierce St Unit 126
- 6832 W Fillmore St Unit 174
- 6833 W Roosevelt St
- 116 N 69th Ave
- 7062 W Garfield St Unit III
- 1616 N 63rd Ave Unit 48
- 6224 W Berkeley Rd
- 6431 W Mckinley St
- 6443 W Mckinley St
- 6425 W Mckinley St
- 6501 W Mckinley St
- 6438 W Fillmore St
- 6444 W Fillmore St
- 6432 W Fillmore St
- 6419 W Mckinley St
- 6432 W Mckinley St
- 6438 W Mckinley St
- 6426 W Fillmore St
- 6426 W Mckinley St
- 6444 W Mckinley St
- 6509 W Mckinley St
- 6420 W Mckinley St
- 6502 W Fillmore St
- 6415 W Mckinley St
- 6502 W Mckinley St
- 6420 W Fillmore St
- 6414 W Mckinley St