
6439 S Chestatee Dahlonega, GA 30533
Estimated payment $11,171/month
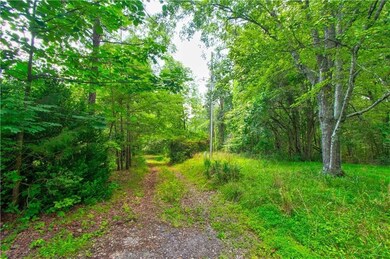
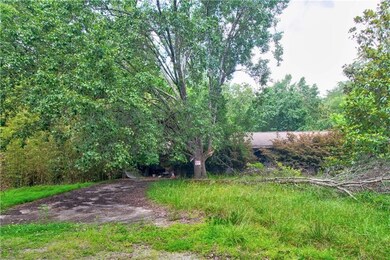
About This Lot
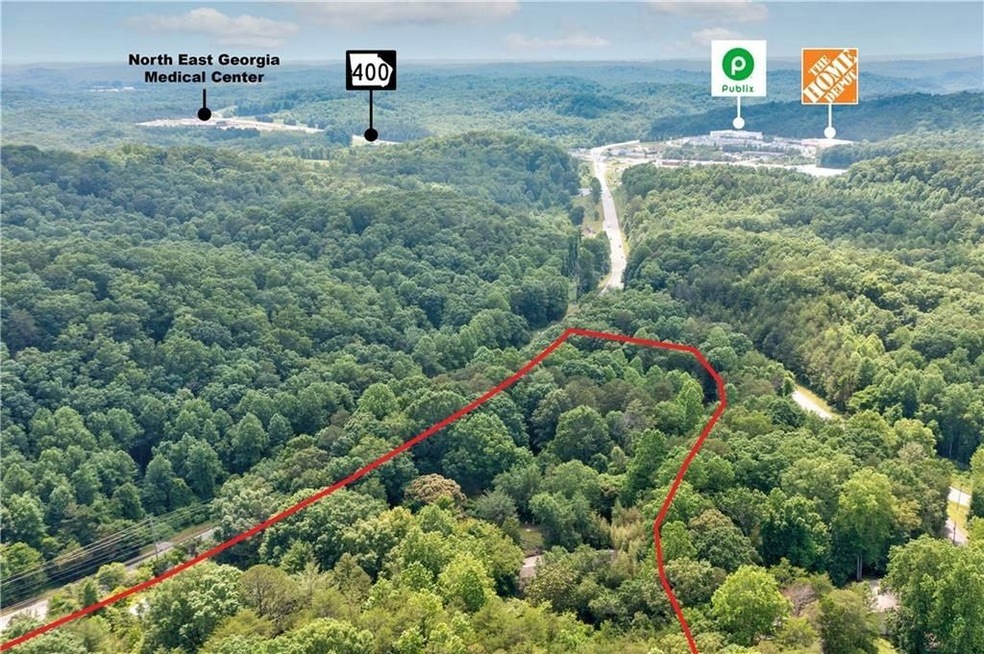
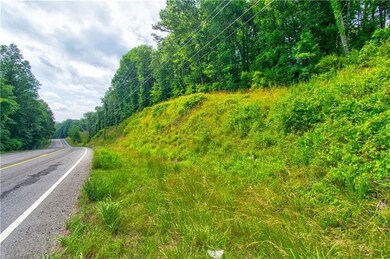
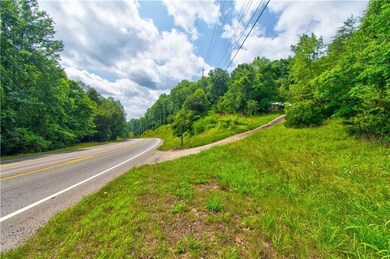
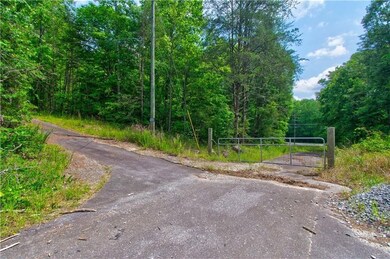
Prime development opportunities just down the road from the growing intersection of 400 & Highway 60! Sewer & water available. State highway frontage ready for development. Gateway Corridor character area (zoning) of Lumpkin County. Highest land use offered. Apartments, multi-family, commercial, retail. Two parcels totaling 8.59-/+ acres with sewer & water, good topography, and proximity to the brand new Publix anchor store. Get in before anyone else. Minutes to the growing University of North Georgia. Minutes to Dawsonville outlet area. Three existing tear down structures on property are not to be entered. Very limited area of Lumpkin County that is allowing this type of land use or development.
Copyright © 2025 First Multiple Listing Service, Inc. All rights reserved. All information provided by the listing agent/broker is deemed reliable but is not guaranteed and should be independently verified.
Leah Smith
Listed on: 05/09/2025

Property Details
Property Type
- Land
Est. Annual Taxes
- $1,242
Lot Details
- Current uses include commercial
- Potential uses include for development
Map
Home Values in the Area
Average Home Value in this Area
Tax History
| Year | Tax Paid | Tax Assessment Tax Assessment Total Assessment is a certain percentage of the fair market value that is determined by local assessors to be the total taxable value of land and additions on the property. | Land | Improvement |
|---|---|---|---|---|
| 2024 | $1,242 | $52,816 | $28,132 | $24,684 |
| 2023 | $1,142 | $48,537 | $25,574 | $22,963 |
| 2022 | $1,040 | $42,006 | $21,316 | $20,690 |
| 2021 | $986 | $38,500 | $21,316 | $17,184 |
| 2020 | $979 | $37,108 | $20,422 | $16,686 |
| 2019 | $988 | $37,108 | $20,422 | $16,686 |
| 2018 | $1,002 | $35,307 | $20,422 | $14,885 |
| 2017 | $1,032 | $35,686 | $20,422 | $15,264 |
| 2016 | $1,008 | $33,712 | $20,422 | $13,290 |
| 2015 | $900 | $33,712 | $20,422 | $13,290 |
| 2014 | $900 | $34,155 | $20,422 | $13,733 |
| 2013 | -- | $34,597 | $20,422 | $14,175 |
Property History
| Date | Event | Price | Change | Sq Ft Price |
|---|---|---|---|---|
| 05/09/2025 05/09/25 | For Sale | $1,999,999 | -- | -- |
Purchase History
| Date | Type | Sale Price | Title Company |
|---|---|---|---|
| Deed | $199,911 | -- | |
| Deed | -- | -- |
- 58 Hampton Forest Ct
- 300 Elliots Ln
- 511 Flanders Rd
- 433 Elliots Ln
- 68 Flynt Ridge Dr
- 187 Angers Ct
- 0 Long Branch Rd Unit 22030489
- 00 Long Branch Rd
- 0 Long Branch Rd Unit 10271720
- 0 Long Branch Rd Unit 10271266
- 0 Long Branch Rd Unit 7357871
- 105 Sandhill Dr
- 5195 S Chestatee
- 0 Fox Mountain Rd Unit 10567656
- 0 Fox Mountain Rd Unit 7616660
- 100 Grainger Rd
- 0 Trillium Trail
- 34 Rustin Ridge
- 95 Silver Fox Ct
- 428 Silas Rd
- 55 Silver Fox Ct
- 37 Rock Garden Place
- 571 Gold Ridge Rd
- 472 Stoneybrook Dr
- 7328 Ivy Cir
- 1823 Auraria Rd
- 3 Bellamy Place
- 48 Mountain View Trail E Unit 8
- 385 Mountain View Trail
- 2538 Ben Higgins Rd
- 113 Roberta Ave
- 215 Stephens St
- 5106 Bird Rd
- 62 Dawson Club Way Unit Myrtle
- 62 Dawson Club Way Unit Caraway
- 62 Dawson Club Way Unit Poppy
- 80 Emmette Dr
- 5332 Lawson Lake Dr
- 4933 Patterson Ln
- 5019 Bird Rd