6439 S Winchester Ave Chicago, IL 60636
Englewood NeighborhoodEstimated Value: $91,000 - $187,000
3
Beds
2
Baths
1,163
Sq Ft
$109/Sq Ft
Est. Value
About This Home
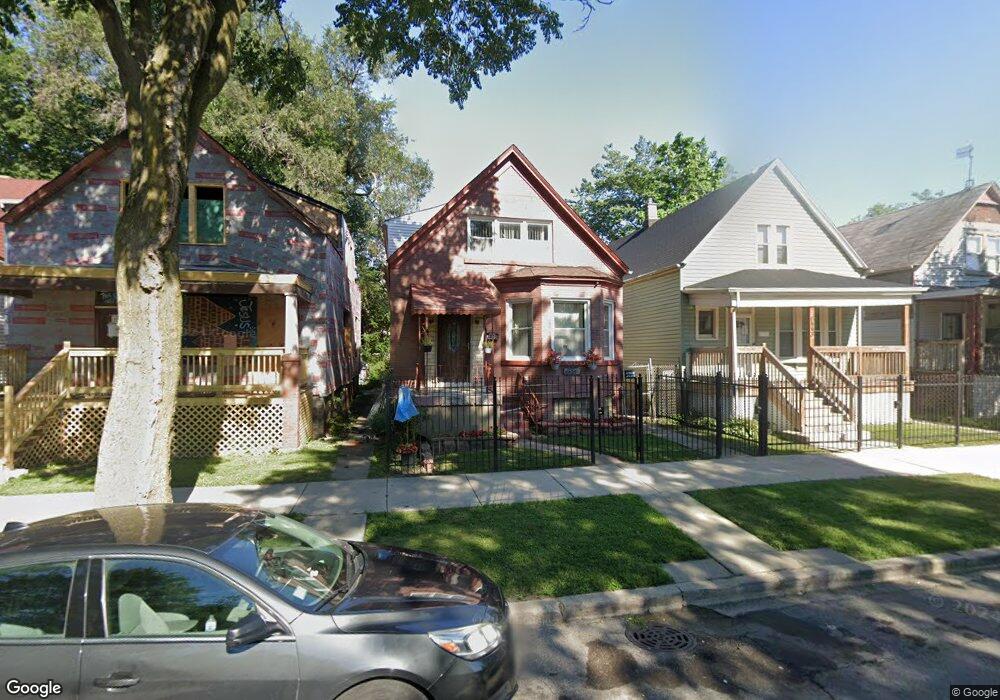
This home is located at 6439 S Winchester Ave, Chicago, IL 60636 and is currently estimated at $127,244, approximately $109 per square foot. 6439 S Winchester Ave is a home located in Cook County with nearby schools including O'Toole Elementary School and Providence-Englewood Elementary Charter School.
Ownership History
Date
Name
Owned For
Owner Type
Purchase Details
Closed on
Sep 7, 1996
Sold by
Smith Henrietta M
Bought by
American National Bk & Tr Co Of Chicago
Current Estimated Value
Create a Home Valuation Report for This Property
The Home Valuation Report is an in-depth analysis detailing your home's value as well as a comparison with similar homes in the area
Home Values in the Area
Average Home Value in this Area
Purchase History
| Date | Buyer | Sale Price | Title Company |
|---|---|---|---|
| American National Bk & Tr Co Of Chicago | -- | -- |
Source: Public Records
Tax History
| Year | Tax Paid | Tax Assessment Tax Assessment Total Assessment is a certain percentage of the fair market value that is determined by local assessors to be the total taxable value of land and additions on the property. | Land | Improvement |
|---|---|---|---|---|
| 2025 | -- | $6,400 | $1,107 | $5,293 |
| 2024 | -- | $6,400 | $1,107 | $5,293 |
| 2023 | -- | $3,867 | $2,399 | $1,468 |
| 2022 | $0 | $3,867 | $2,399 | $1,468 |
| 2021 | $1,018 | $3,866 | $2,398 | $1,468 |
| 2020 | $1,018 | $7,670 | $2,398 | $5,272 |
| 2019 | $1,043 | $8,619 | $2,398 | $6,221 |
| 2018 | $1,024 | $8,619 | $2,398 | $6,221 |
| 2017 | $1,421 | $9,976 | $2,214 | $7,762 |
| 2016 | $1,498 | $9,976 | $2,214 | $7,762 |
| 2015 | $1,828 | $9,976 | $2,214 | $7,762 |
| 2014 | $1,571 | $8,470 | $2,029 | $6,441 |
| 2013 | $721 | $8,470 | $2,029 | $6,441 |
Source: Public Records
Map
Nearby Homes
- 6427 S Winchester Ave
- 6454 S Winchester Ave
- 6607 S Winchester Ave
- 6534 S Honore St
- 6432 S Damen Ave
- 6444 S Hermitage Ave
- 6423 S Hoyne Ave
- 6640 S Wolcott Ave
- 6442 S Paulina St
- 6526 S Hoyne Ave
- 1820 W Marquette Rd
- 6336 S Paulina St
- 6221 S Wolcott Ave
- 6243 S Wood St
- 6545 S Hamilton Ave
- 6335 S Paulina St
- 6206 S Winchester Ave
- 1638 W Marquette Rd
- 6245 S Hermitage Ave
- 6455 S Marshfield Ave
- 6443 S Winchester Ave
- 6437 S Winchester Ave
- 6437 S Winchester Ave
- 6445 S Winchester Ave
- 6433 S Winchester Ave
- 6447 S Winchester Ave
- 6431 S Winchester Ave
- 6451 S Winchester Ave
- 6453 S Winchester Ave
- 6438 S Wolcott Ave
- 6425 S Winchester Ave
- 6434 S Wolcott Ave
- 6434 S Wolcott Ave
- 6455 S Winchester Ave
- 6446 S Wolcott Ave
- 6440 S Winchester Ave
- 6430 S Wolcott Ave
- 6442 S Wolcott Ave
- 6423 S Winchester Ave
- 6450 S Wolcott Ave
Your Personal Tour Guide
Ask me questions while you tour the home.