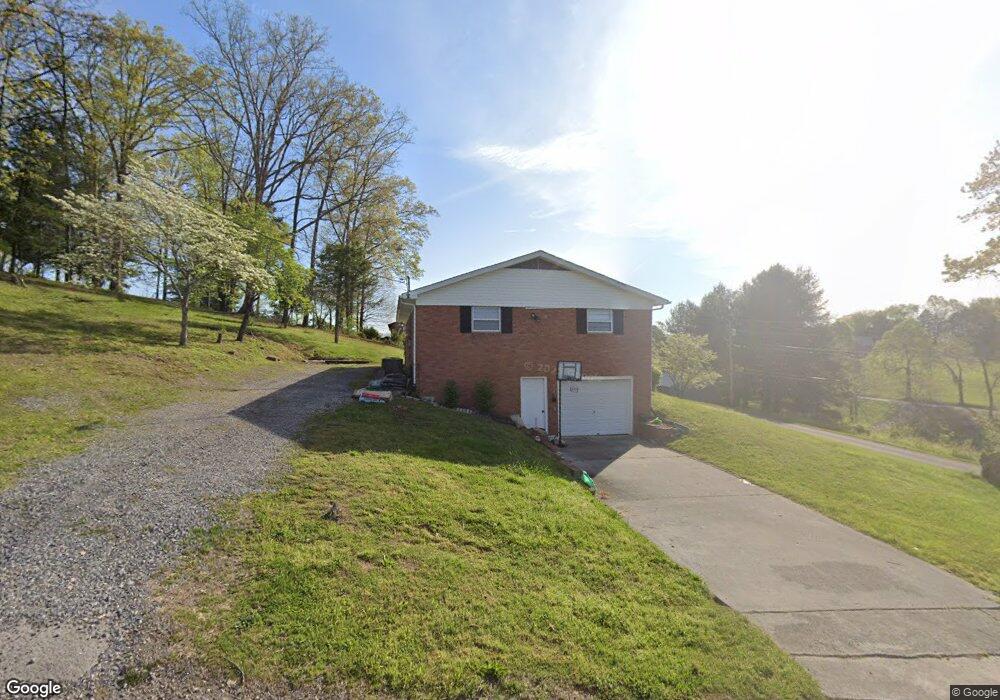
644 Ailshie Rd Morristown, TN 37813
Estimated Value: $143,000 - $203,000
--
Bed
1
Bath
1,161
Sq Ft
$150/Sq Ft
Est. Value
About This Home
This home is located at 644 Ailshie Rd, Morristown, TN 37813 and is currently estimated at $174,548, approximately $150 per square foot. 644 Ailshie Rd is a home located in Hamblen County with nearby schools including Witt Elementary School, Lincoln Heights Middle School, and Morristown West High School.
Ownership History
Date
Name
Owned For
Owner Type
Purchase Details
Closed on
Jun 1, 2021
Sold by
Roy Karen Sue
Bought by
Rhines Heather
Current Estimated Value
Home Financials for this Owner
Home Financials are based on the most recent Mortgage that was taken out on this home.
Original Mortgage
$109,250
Outstanding Balance
$98,912
Interest Rate
2.9%
Mortgage Type
New Conventional
Estimated Equity
$75,636
Purchase Details
Closed on
Jan 23, 2014
Sold by
Depriest Karen S
Bought by
Roy Karen Sue
Purchase Details
Closed on
Nov 1, 2006
Sold by
Helen Dixson
Bought by
Depriest Karen S
Home Financials for this Owner
Home Financials are based on the most recent Mortgage that was taken out on this home.
Original Mortgage
$50,000
Interest Rate
6.25%
Purchase Details
Closed on
Jul 22, 1977
Bought by
Dixon Delbert
Create a Home Valuation Report for This Property
The Home Valuation Report is an in-depth analysis detailing your home's value as well as a comparison with similar homes in the area
Home Values in the Area
Average Home Value in this Area
Purchase History
| Date | Buyer | Sale Price | Title Company |
|---|---|---|---|
| Rhines Heather | $115,000 | Colonial Title Group Inc | |
| Roy Karen Sue | -- | -- | |
| Roy Karen Sue | -- | -- | |
| Depriest Karen S | $92,000 | -- | |
| Dixon Delbert | -- | -- |
Source: Public Records
Mortgage History
| Date | Status | Borrower | Loan Amount |
|---|---|---|---|
| Open | Rhines Heather | $109,250 | |
| Previous Owner | Dixon Delbert | $50,000 |
Source: Public Records
Tax History Compared to Growth
Tax History
| Year | Tax Paid | Tax Assessment Tax Assessment Total Assessment is a certain percentage of the fair market value that is determined by local assessors to be the total taxable value of land and additions on the property. | Land | Improvement |
|---|---|---|---|---|
| 2024 | $468 | $23,750 | $3,200 | $20,550 |
| 2023 | $468 | $23,750 | $0 | $0 |
| 2022 | $468 | $23,750 | $3,200 | $20,550 |
| 2021 | $468 | $23,750 | $3,200 | $20,550 |
| 2020 | $468 | $23,750 | $3,200 | $20,550 |
| 2019 | $469 | $22,025 | $3,200 | $18,825 |
| 2018 | $469 | $22,025 | $3,200 | $18,825 |
| 2017 | $469 | $22,025 | $3,200 | $18,825 |
| 2016 | $438 | $22,025 | $3,200 | $18,825 |
| 2015 | $407 | $22,025 | $3,200 | $18,825 |
| 2014 | -- | $22,025 | $3,200 | $18,825 |
| 2013 | -- | $23,825 | $0 | $0 |
Source: Public Records
Map
Nearby Homes
- 3520 Sublett Rd
- 848 Spencer Hale Rd
- 1500 S Davy Crockett Pkwy
- 453 Statem Gap Rd
- 5056 Spencer Hale Rd
- 5474 Saint Paul Rd
- 1160 Statem Gap Rd
- 2895 Coffey Rd
- 1418 Mae Collins Rd
- 2262 Fernwood Church Rd
- 1051 Wilson Hale Rd
- 4996 Saint Paul Rd
- 5704 Long Creek Rd
- 4207 Clyde Thomas Rd
- 2945 Enka Hwy
- 1256 Arden Ln
- 1163 Nathan Dr
- 0 Old White Pine Rd
- 305-365 Barkley Landing Dr
- 0 Tbd River View Dr Unit Lot@WP001
- 658 Ailshie Rd
- 623 Ailshie Rd
- 645 Ailshie Rd
- 670 Ailshie Rd
- 651 Ailshie Rd
- 660 Watkins Chapel Rd
- 637 Ailshie Rd
- 671 Ailshie Rd
- 674 Ailshie Rd
- 622 Ailshie Rd
- 670 Watkins Chapel Rd
- 691 Ailshie Rd
- 680 Watkins Chapel Rd
- 684 Ailshie Rd
- 1091 Old Witt Rd
- 697 Ailshie Rd
- 1081 Old Witt Rd
- 696 Ailshie Rd
- 1071 Old Witt Rd
- 525 Watkins Chapel Rd