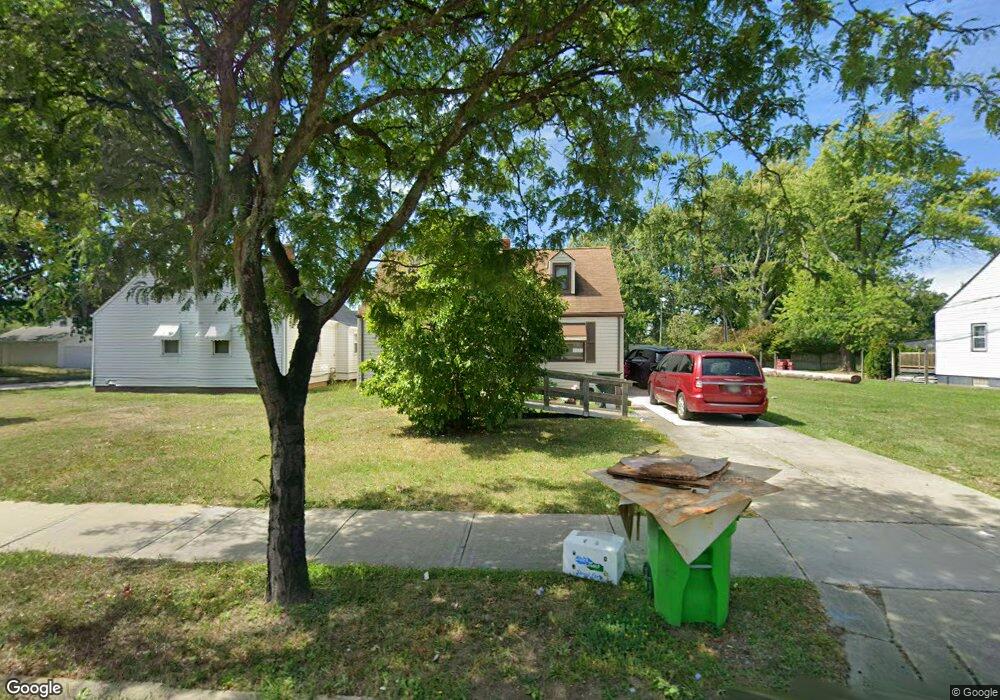
644 E 260th St Euclid, OH 44132
Estimated Value: $118,547 - $136,000
2
Beds
1
Bath
1,152
Sq Ft
$112/Sq Ft
Est. Value
About This Home
This home is located at 644 E 260th St, Euclid, OH 44132 and is currently estimated at $129,137, approximately $112 per square foot. 644 E 260th St is a home located in Cuyahoga County with nearby schools including Shoreview Elementary School, Euclid High School, and Ss Robert & William Catholic School.
Ownership History
Date
Name
Owned For
Owner Type
Purchase Details
Closed on
Nov 6, 2003
Sold by
Elek David C
Bought by
Rawley Michael J and Finkler Brian
Current Estimated Value
Home Financials for this Owner
Home Financials are based on the most recent Mortgage that was taken out on this home.
Original Mortgage
$81,000
Outstanding Balance
$37,604
Interest Rate
6.02%
Mortgage Type
Purchase Money Mortgage
Estimated Equity
$91,533
Purchase Details
Closed on
Nov 27, 1990
Sold by
Smola Ronald J
Bought by
Elek David C
Purchase Details
Closed on
Oct 9, 1986
Sold by
Molnar Bret L
Bought by
Smola Ronald J
Purchase Details
Closed on
Oct 30, 1980
Sold by
Sintic John
Bought by
Molnar Bret L
Purchase Details
Closed on
Feb 23, 1977
Sold by
Demko James E and Demko Eleanor J
Bought by
Sintic John
Purchase Details
Closed on
Jan 1, 1975
Bought by
Demko James E and Demko Eleanor J
Create a Home Valuation Report for This Property
The Home Valuation Report is an in-depth analysis detailing your home's value as well as a comparison with similar homes in the area
Home Values in the Area
Average Home Value in this Area
Purchase History
| Date | Buyer | Sale Price | Title Company |
|---|---|---|---|
| Rawley Michael J | $75,000 | First Service Title Agency I | |
| Elek David C | $51,000 | -- | |
| Smola Ronald J | $45,500 | -- | |
| Molnar Bret L | $47,000 | -- | |
| Sintic John | $27,000 | -- | |
| Demko James E | -- | -- |
Source: Public Records
Mortgage History
| Date | Status | Borrower | Loan Amount |
|---|---|---|---|
| Open | Rawley Michael J | $81,000 |
Source: Public Records
Tax History
| Year | Tax Paid | Tax Assessment Tax Assessment Total Assessment is a certain percentage of the fair market value that is determined by local assessors to be the total taxable value of land and additions on the property. | Land | Improvement |
|---|---|---|---|---|
| 2024 | $2,774 | $39,340 | $7,070 | $32,270 |
| 2023 | $2,350 | $26,360 | $6,370 | $19,990 |
| 2022 | $2,257 | $26,360 | $6,370 | $19,990 |
| 2021 | $2,511 | $26,360 | $6,370 | $19,990 |
| 2020 | $2,382 | $22,720 | $5,500 | $17,220 |
| 2019 | $2,291 | $64,900 | $15,700 | $49,200 |
| 2018 | $2,121 | $22,720 | $5,500 | $17,220 |
| 2017 | $2,258 | $19,850 | $4,550 | $15,300 |
| 2016 | $2,263 | $19,850 | $4,550 | $15,300 |
| 2015 | $2,062 | $19,850 | $4,550 | $15,300 |
| 2014 | $2,062 | $19,850 | $4,550 | $15,300 |
Source: Public Records
Map
Nearby Homes
- 25751 Briardale Ave
- 25700 Briardale Ave
- 579 E 260th St
- 643 E 261st St
- 571 E 260th St
- 25671 Farringdon Ave
- 25650 Richards Ave
- 25731 Zeman Ave
- 26351 Farringdon Ave
- 26430 Drakefield Ave
- 25401 Farringdon Ave
- 515 E 250th St
- 25151 Zeman Ave
- 610 E 266th St
- 464 E 250th St
- 26831 Shoreview Ave
- 24891 Zeman Ave
- 825 E 256th St
- 26931 Shoreview Ave
- 355 E 257th St
- 640 E 260th St
- 634 E 260th St
- 25871 Briardale Ave
- 630 E 260th St
- 25851 Briardale Ave
- 660 E 260th St
- 25870 Drakefield Ave
- 624 E 260th St
- 25801 Briardale Ave
- 670 E 260th St
- 25850 Drakefield Ave
- 25870 Briardale Ave
- 25800 Drakefield Ave
- 641 E 260th St
- 661 E 260th St
- 631 E 260th St
- 25850 Briardale Ave
- 676 E 260th St
- 651 E 260th St
- 665 E 260th St
Your Personal Tour Guide
Ask me questions while you tour the home.