644 E Bangham Rd Cookeville, TN 38501
Estimated Value: $354,657 - $509,000
3
Beds
3
Baths
2,650
Sq Ft
$172/Sq Ft
Est. Value
About This Home
This home is located at 644 E Bangham Rd, Cookeville, TN 38501 and is currently estimated at $455,164, approximately $171 per square foot. 644 E Bangham Rd is a home located in Putnam County with nearby schools including Cookeville High School, Algood Middle School, and Northeast Elementary School.
Ownership History
Date
Name
Owned For
Owner Type
Purchase Details
Closed on
Oct 15, 2010
Sold by
Jones Jeanette Elisabeth
Bought by
Jones Jeanette Elisabeth
Current Estimated Value
Purchase Details
Closed on
Feb 14, 2008
Sold by
Debra Johnson
Bought by
Elisabeth Jones Jeanette
Home Financials for this Owner
Home Financials are based on the most recent Mortgage that was taken out on this home.
Original Mortgage
$174,000
Interest Rate
5.65%
Purchase Details
Closed on
Dec 14, 2006
Sold by
Johnson Dale L
Bought by
Debra Johnson
Purchase Details
Closed on
Jul 9, 1998
Sold by
Tucker Billy J
Bought by
Johnson Dale L and Johnson Debra
Purchase Details
Closed on
Dec 23, 1997
Sold by
Scott Conner James
Bought by
Tucker Billy J and Tucker Kimberly
Home Financials for this Owner
Home Financials are based on the most recent Mortgage that was taken out on this home.
Original Mortgage
$144,200
Interest Rate
7.2%
Purchase Details
Closed on
Apr 26, 1996
Bought by
Conner James Scott and Conner Tonya
Create a Home Valuation Report for This Property
The Home Valuation Report is an in-depth analysis detailing your home's value as well as a comparison with similar homes in the area
Home Values in the Area
Average Home Value in this Area
Purchase History
| Date | Buyer | Sale Price | Title Company |
|---|---|---|---|
| Jones Jeanette Elisabeth | -- | -- | |
| Elisabeth Jones Jeanette | $194,000 | -- | |
| Debra Johnson | -- | -- | |
| Johnson Dale L | $155,000 | -- | |
| Tucker Billy J | $140,000 | -- | |
| Conner James Scott | $16,300 | -- |
Source: Public Records
Mortgage History
| Date | Status | Borrower | Loan Amount |
|---|---|---|---|
| Previous Owner | Conner James Scott | $174,000 | |
| Previous Owner | Conner James Scott | $144,200 |
Source: Public Records
Tax History Compared to Growth
Tax History
| Year | Tax Paid | Tax Assessment Tax Assessment Total Assessment is a certain percentage of the fair market value that is determined by local assessors to be the total taxable value of land and additions on the property. | Land | Improvement |
|---|---|---|---|---|
| 2024 | $1,660 | $62,400 | $13,225 | $49,175 |
| 2023 | $1,660 | $62,400 | $13,225 | $49,175 |
| 2022 | $1,543 | $62,400 | $13,225 | $49,175 |
| 2021 | $1,543 | $62,400 | $13,225 | $49,175 |
| 2020 | $1,388 | $62,400 | $13,225 | $49,175 |
| 2019 | $1,388 | $47,450 | $11,725 | $35,725 |
| 2018 | $1,295 | $47,450 | $11,725 | $35,725 |
| 2017 | $1,295 | $47,450 | $11,725 | $35,725 |
| 2016 | $1,295 | $47,450 | $11,725 | $35,725 |
| 2015 | $1,331 | $47,450 | $11,725 | $35,725 |
| 2014 | $1,198 | $42,698 | $0 | $0 |
Source: Public Records
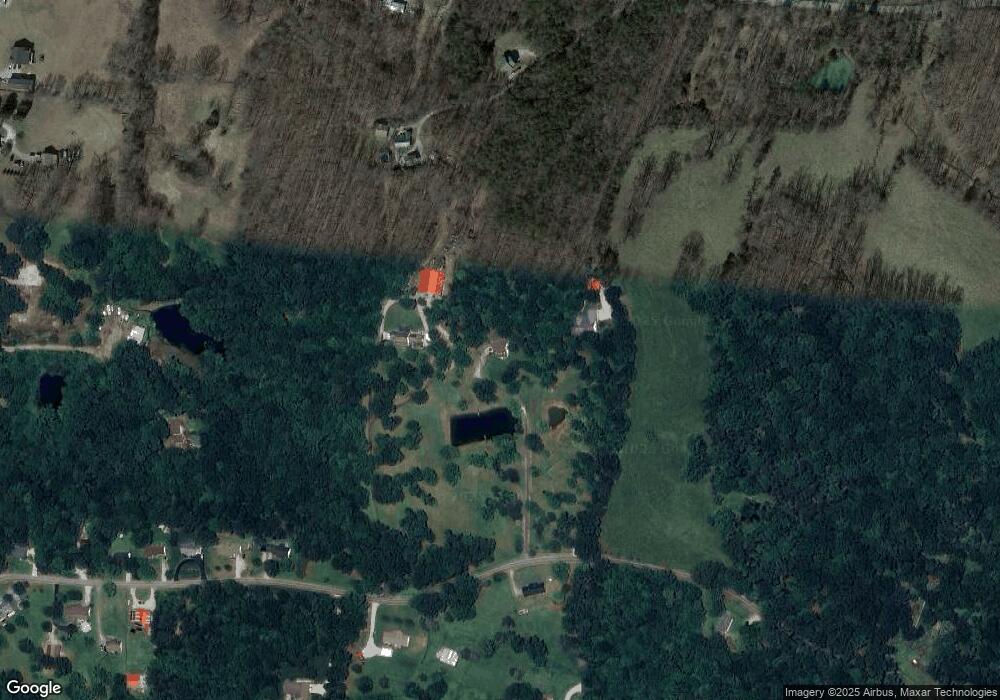
Map
Nearby Homes
- 658 E Bangham Rd
- 600 E Bangham Rd
- 537 E Whitehall Rd
- 649 E Bangham Rd
- 533 E Whitehall Rd
- 440 E Bangham Rd
- 6053 Fairview Rd
- 416 E Bangham Rd
- 787 E Bangham Rd
- 392 E Bangham Rd
- 463 E Bangham Rd
- 374 E Bangham Rd
- 523 E Whitehall Rd
- 425 E Whitehall Rd
- 356 E Bangham Rd
- 401 E Whitehall Rd
- 361 E Bangham Rd
- 361 E Bangham Rd
- 361 E Bangham Rd
- 5924 Penthouse Rd