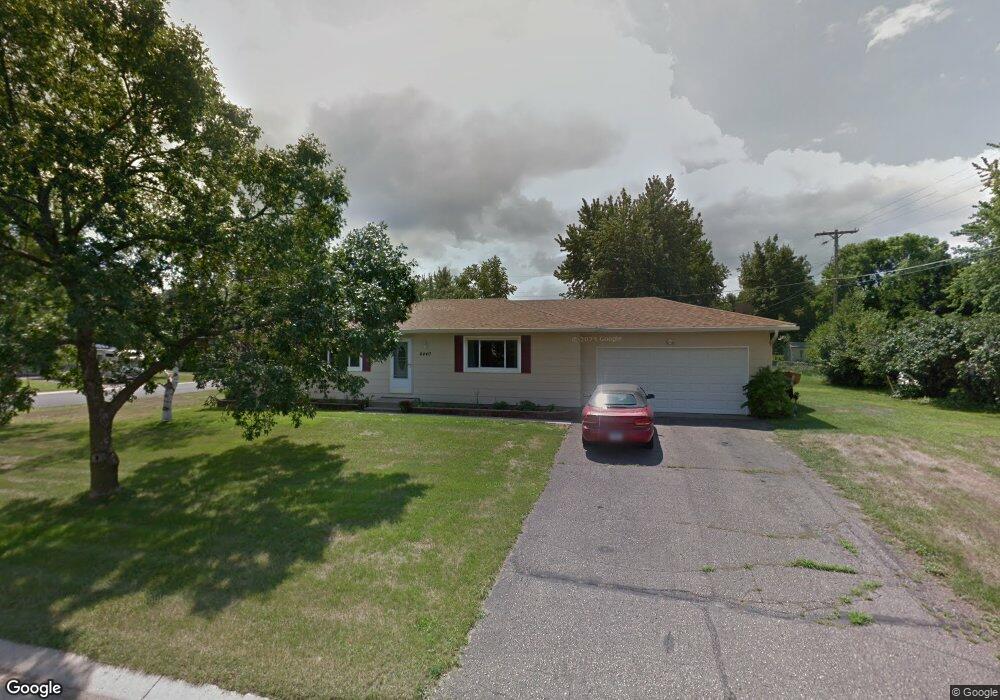
6440 163rd St W Rosemount, MN 55068
Estimated Value: $349,000 - $376,000
3
Beds
2
Baths
1,152
Sq Ft
$315/Sq Ft
Est. Value
About This Home
This home is located at 6440 163rd St W, Rosemount, MN 55068 and is currently estimated at $363,116, approximately $315 per square foot. 6440 163rd St W is a home located in Dakota County with nearby schools including Parkview Elementary School, Scott Highlands Middle School, and Rosemount Senior High School.
Ownership History
Date
Name
Owned For
Owner Type
Purchase Details
Closed on
Nov 22, 2019
Sold by
Dutton Kari
Bought by
Dutton Andrew J
Current Estimated Value
Purchase Details
Closed on
Jul 29, 2011
Sold by
A2z Realty Inc
Bought by
Boger Anne K and Larson Joshua J
Home Financials for this Owner
Home Financials are based on the most recent Mortgage that was taken out on this home.
Original Mortgage
$7,500
Outstanding Balance
$5,204
Interest Rate
4.54%
Mortgage Type
Unknown
Estimated Equity
$357,912
Purchase Details
Closed on
Jan 18, 2011
Sold by
Citimortgage Inc
Bought by
A 2 Z Realty Inc
Purchase Details
Closed on
May 15, 2006
Sold by
Thanghe Marnelle Lenore
Bought by
Ryan Dan
Purchase Details
Closed on
Oct 22, 2004
Sold by
Feeser William R and Feeser Janet E
Bought by
Thanghe Malinda Jane and Thanghe Marnelle Lenore
Create a Home Valuation Report for This Property
The Home Valuation Report is an in-depth analysis detailing your home's value as well as a comparison with similar homes in the area
Home Values in the Area
Average Home Value in this Area
Purchase History
| Date | Buyer | Sale Price | Title Company |
|---|---|---|---|
| Dutton Andrew J | -- | Results Title | |
| Boger Anne K | $184,900 | Title Recording Services | |
| A 2 Z Realty Inc | $85,000 | -- | |
| Ryan Dan | $246,000 | -- | |
| Thanghe Malinda Jane | $243,500 | -- |
Source: Public Records
Mortgage History
| Date | Status | Borrower | Loan Amount |
|---|---|---|---|
| Open | Boger Anne K | $7,500 | |
| Open | Boger Anne K | $180,212 |
Source: Public Records
Tax History Compared to Growth
Tax History
| Year | Tax Paid | Tax Assessment Tax Assessment Total Assessment is a certain percentage of the fair market value that is determined by local assessors to be the total taxable value of land and additions on the property. | Land | Improvement |
|---|---|---|---|---|
| 2024 | $3,318 | $293,600 | $67,400 | $226,200 |
| 2023 | $3,318 | $296,800 | $67,200 | $229,600 |
| 2022 | $2,798 | $286,900 | $67,000 | $219,900 |
| 2021 | $2,678 | $241,000 | $58,300 | $182,700 |
| 2020 | $2,706 | $222,700 | $55,500 | $167,200 |
| 2019 | $2,448 | $218,600 | $51,300 | $167,300 |
| 2018 | $2,338 | $206,100 | $48,800 | $157,300 |
| 2017 | $2,306 | $191,400 | $46,500 | $144,900 |
| 2016 | $2,188 | $180,700 | $44,300 | $136,400 |
| 2015 | $2,096 | $146,207 | $37,355 | $108,852 |
| 2014 | -- | $139,776 | $35,977 | $103,799 |
| 2013 | -- | $125,824 | $32,213 | $93,611 |
Source: Public Records
Map
Nearby Homes
- 6634 162nd Ct Unit 421
- 16563 Fishing Ave W
- 6656 Gerdine Path W
- 6744 Foliage Ct W
- 6414 158th St W Unit 201
- 16546 Foliage Ave W
- 15792 Flan Ct
- 6649 167th St W
- 6678 166th St W
- 6852 161st St W
- 15767 Finch Ave
- 6406 157th St W
- 15682 Fjord Ave
- 6760 158th St W
- 15681 Flackwood Way
- 15649 Flackwood Way
- 15675 Flackwood Way
- 6456 157th St W
- 15854 Frisian Ln
- 15823 Freedom Ln
- 6440 6440 163rd St W
- 16317 Fishing Ave W
- 6450 163rd St W
- 6435 163rd St W
- 16306 Flagstaff Ave W
- 16323 Fishing Ave W
- 16312 Fishing Ave W
- 6455 163rd St W
- 16312 Flagstaff Ave W
- 16320 Fishing Ave W
- 16225 Fishing Ave W
- 16242 Fishing Ave W
- 16335 Fishing Ave W
- 16226 Flagstaff Ave W
- 16266 Finland Ave W
- 16330 Flagstaff Ave W
- 16338 Fishing Ave W
- 16207 Fishing Ave W
- 16347 16347 Fishing Ave W
- 16208 16208 Flagstaff Ave W