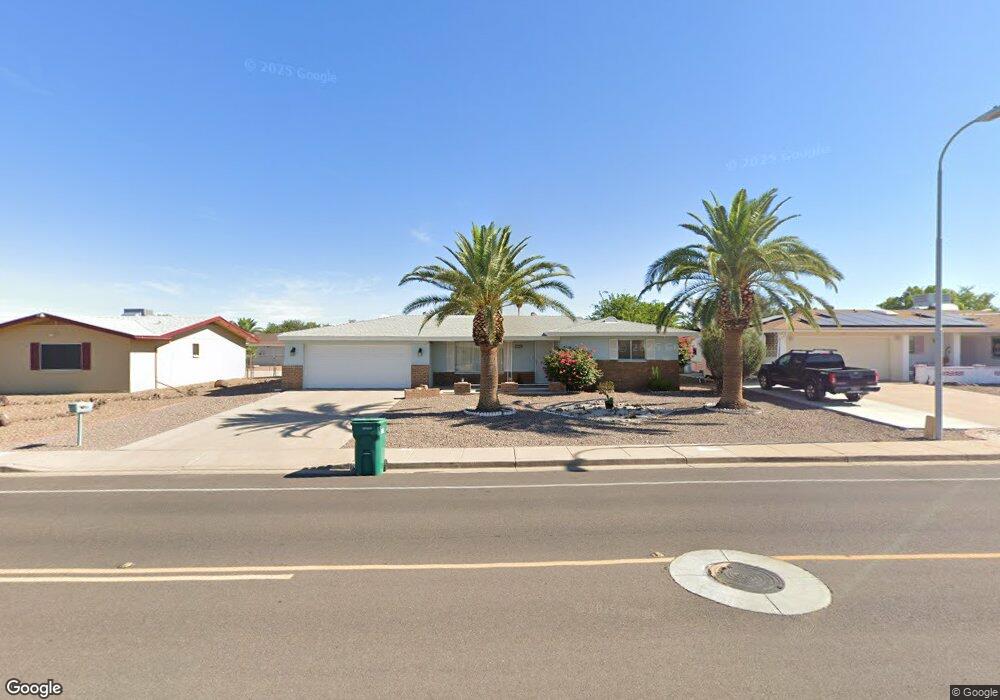
6440 E Adobe Rd Mesa, AZ 85205
Central Mesa East NeighborhoodEstimated Value: $284,000 - $328,000
2
Beds
2
Baths
1,118
Sq Ft
$274/Sq Ft
Est. Value
About This Home
This home is located at 6440 E Adobe Rd, Mesa, AZ 85205 and is currently estimated at $306,171, approximately $273 per square foot. 6440 E Adobe Rd is a home located in Maricopa County with nearby schools including Salk Elementary School, Franklin at Brimhall Elementary School, and Franklin West Elementary School.
Ownership History
Date
Name
Owned For
Owner Type
Purchase Details
Closed on
May 7, 2020
Sold by
Pemberton Anjela L
Bought by
A & C Street Llc
Current Estimated Value
Purchase Details
Closed on
Mar 8, 2018
Sold by
Chapman Eldon and Chapman Patrica
Bought by
Pemberton Anjela
Purchase Details
Closed on
Aug 17, 2005
Sold by
Beluga Peak Llc
Bought by
Chapman Eldon and Chapman Patricia
Home Financials for this Owner
Home Financials are based on the most recent Mortgage that was taken out on this home.
Original Mortgage
$140,000
Interest Rate
5.68%
Mortgage Type
New Conventional
Purchase Details
Closed on
May 19, 2005
Sold by
Naeve Martin M
Bought by
Beluga Peak Llc
Home Financials for this Owner
Home Financials are based on the most recent Mortgage that was taken out on this home.
Original Mortgage
$67,500
Interest Rate
5.87%
Mortgage Type
Seller Take Back
Create a Home Valuation Report for This Property
The Home Valuation Report is an in-depth analysis detailing your home's value as well as a comparison with similar homes in the area
Home Values in the Area
Average Home Value in this Area
Purchase History
| Date | Buyer | Sale Price | Title Company |
|---|---|---|---|
| A & C Street Llc | -- | None Available | |
| Pemberton Anjela | $146,500 | Accommodation | |
| Chapman Eldon | $175,000 | -- | |
| Beluga Peak Llc | $135,000 | Security Title Agency Inc |
Source: Public Records
Mortgage History
| Date | Status | Borrower | Loan Amount |
|---|---|---|---|
| Previous Owner | Chapman Eldon | $140,000 | |
| Previous Owner | Beluga Peak Llc | $67,500 | |
| Closed | Chapman Eldon | $35,000 |
Source: Public Records
Tax History
| Year | Tax Paid | Tax Assessment Tax Assessment Total Assessment is a certain percentage of the fair market value that is determined by local assessors to be the total taxable value of land and additions on the property. | Land | Improvement |
|---|---|---|---|---|
| 2025 | $1,119 | $11,815 | -- | -- |
| 2024 | $1,128 | $11,252 | -- | -- |
| 2023 | $1,128 | $22,880 | $4,570 | $18,310 |
| 2022 | $1,100 | $17,100 | $3,420 | $13,680 |
| 2021 | $1,098 | $15,860 | $3,170 | $12,690 |
| 2020 | $1,088 | $14,200 | $2,840 | $11,360 |
| 2019 | $1,019 | $12,370 | $2,470 | $9,900 |
| 2018 | $838 | $11,370 | $2,270 | $9,100 |
| 2017 | $813 | $10,380 | $2,070 | $8,310 |
| 2016 | $786 | $9,800 | $1,960 | $7,840 |
| 2015 | $740 | $9,680 | $1,930 | $7,750 |
Source: Public Records
Map
Nearby Homes
- 6522 E Adobe Rd
- 6231 E Ellis St
- 6458 E Elmwood St
- 6218 E Dodge St
- 6222 E El Paso St
- 864 N 62nd St
- 6304 E Fairfield St
- 6335 E Brown Rd Unit 1096
- 6713 E Des Moines St
- 6740 E Adobe St
- 6610 E University Dr Unit 111
- 6610 E University Dr Unit 55
- 6610 E University Dr Unit 43
- 643 N 67th Place
- 635 N 67th Place
- 6058 E El Paso St
- 6720 E Encanto St Unit 20
- 6720 E Encanto St Unit 60
- 6454 E University Dr Unit 8
- 6051 E Ensenada St
- 6448 E Adobe Rd
- 6432 E Adobe Rd
- 6432 E Adobe St
- 6441 E Ellis St
- 6441 E Ellis St
- 6433 E Ellis St
- 6456 E Adobe Rd
- 6424 E Adobe St
- 6424 E Adobe Rd
- 6441 E Adobe Rd
- 6425 E Ellis St
- 6457 E Ellis St
- 6433 E Adobe Rd
- 6425 E Adobe Rd
- 6464 E Adobe Rd
- 6416 E Adobe Rd
- 6457 E Adobe Rd
- 6440 E Ellis St
- 6417 E Ellis St
- 6465 E Ellis St
Your Personal Tour Guide
Ask me questions while you tour the home.