B
Seller's Agent in 2024
Bambi Couturier
Farnsworth-Ricks Management & Realty, Inc.
(480) 924-1300
3 in this area
4 Total Sales
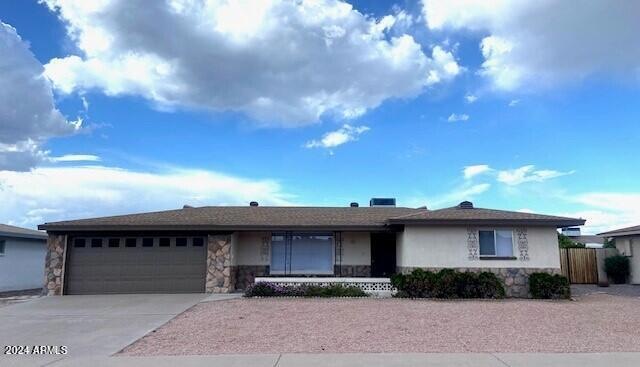

Estimated Value: $285,000 - $327,000
Head North on 64th St. from university ,Turn East on Des Moines. East on Des Moines to 6440 E Des Moines St.
Last Agent to Sell the Property
Farnsworth-Ricks Management & Realty, Inc. License #SA696360000 Listed on: 03/20/2024
| Date | Buyer | Sale Price | Title Company |
|---|---|---|---|
| Kline Kenneth | $321,000 | Title Service And Escrow | |
| Billbe Michael Joe | -- | None Available |
| Date | Status | Borrower | Loan Amount |
|---|---|---|---|
| Open | Kline Kenneth | $150,000 |
| Date | Event | Price | List to Sale | Price per Sq Ft |
|---|---|---|---|---|
| 05/30/2024 05/30/24 | Sold | $321,000 | -8.3% | $249 / Sq Ft |
| 05/08/2024 05/08/24 | Pending | -- | -- | -- |
| 03/20/2024 03/20/24 | For Sale | $350,000 | -- | $272 / Sq Ft |
| Year | Tax Paid | Tax Assessment Tax Assessment Total Assessment is a certain percentage of the fair market value that is determined by local assessors to be the total taxable value of land and additions on the property. | Land | Improvement |
|---|---|---|---|---|
| 2025 | $884 | $11,401 | -- | -- |
| 2024 | $1,089 | $10,858 | -- | -- |
| 2023 | $1,089 | $23,830 | $4,760 | $19,070 |
| 2022 | $1,063 | $17,870 | $3,570 | $14,300 |
| 2021 | $1,060 | $16,550 | $3,310 | $13,240 |
| 2020 | $1,051 | $13,880 | $2,770 | $11,110 |
| 2019 | $984 | $12,120 | $2,420 | $9,700 |
| 2018 | $961 | $11,100 | $2,220 | $8,880 |
| 2017 | $934 | $10,100 | $2,020 | $8,080 |
| 2016 | $907 | $9,470 | $1,890 | $7,580 |
| 2015 | $716 | $9,310 | $1,860 | $7,450 |
B
Seller's Agent in 2024
Bambi Couturier
Farnsworth-Ricks Management & Realty, Inc.
(480) 924-1300
3 in this area
4 Total Sales

Seller Co-Listing Agent in 2024
Carole Steiner
Farnsworth-Ricks Management & Realty, Inc.
(480) 432-1727
13 in this area
27 Total Sales
Buyer's Agent in 2024
Lisa Reyes
eXp Realty
(480) 467-4900
1 in this area
14 Total Sales
Source: Arizona Regional Multiple Listing Service (ARMLS)
MLS Number: 6679698
APN: 141-62-230
Disclaimer: Certain information contained herein is derived from information provided by parties other than Homes.com. All information provided is deemed reliable, but is not guaranteed to be accurate and should be independently verified.
![]() All information should be verified by the recipient and none is guaranteed as accurate by ARMLS
All information should be verified by the recipient and none is guaranteed as accurate by ARMLS
Listing Information presented by local MLS brokerage: Ten-X, local REALTOR®- Arlene Richardson - (888)-952-6393
Ask me questions while you tour the home.