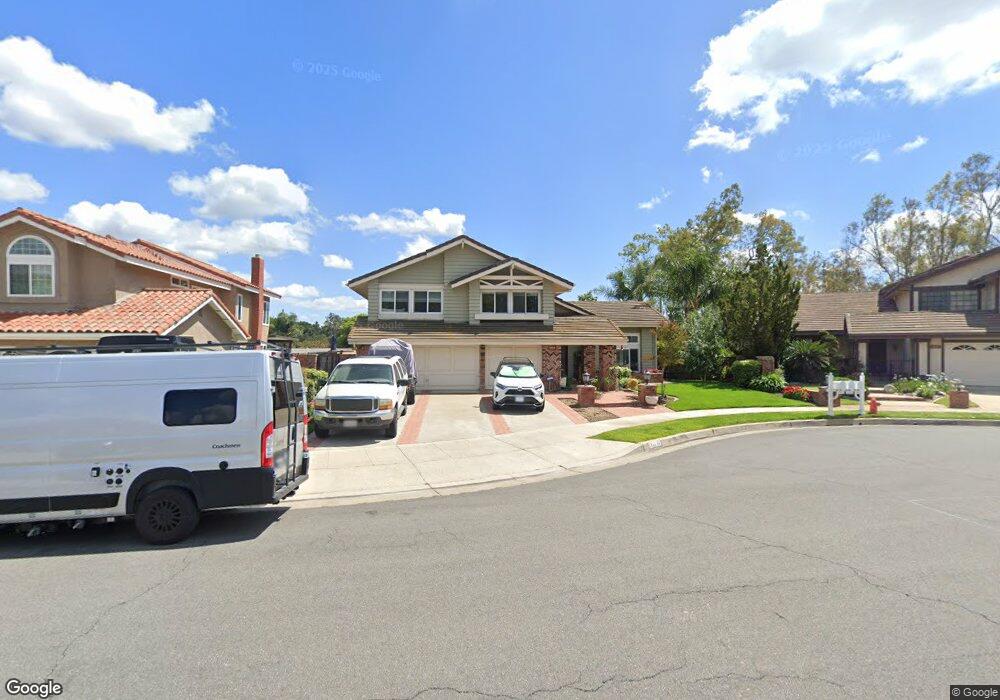
6444 E Joshua Tree Ave Orange, CA 92867
Estimated Value: $1,611,000 - $1,718,000
4
Beds
3
Baths
2,646
Sq Ft
$626/Sq Ft
Est. Value
About This Home
This home is located at 6444 E Joshua Tree Ave, Orange, CA 92867 and is currently estimated at $1,656,793, approximately $626 per square foot. 6444 E Joshua Tree Ave is a home located in Orange County with nearby schools including Linda Vista Elementary School, Cerro Villa Middle School, and Villa Park High School.
Ownership History
Date
Name
Owned For
Owner Type
Purchase Details
Closed on
Nov 28, 2012
Sold by
Lehner Mark K
Bought by
Lehner Mark K and Lehner Judy R
Current Estimated Value
Purchase Details
Closed on
Dec 1, 2011
Sold by
Lehner Mark and Lehner Judy
Bought by
Lehner Mark K and Lehner Judy R
Purchase Details
Closed on
Jan 2, 2002
Sold by
Lehner Mark and Lehner Judy
Bought by
Lehner Mark and Lehner Judy
Home Financials for this Owner
Home Financials are based on the most recent Mortgage that was taken out on this home.
Original Mortgage
$448,000
Outstanding Balance
$179,031
Interest Rate
6.73%
Estimated Equity
$1,477,762
Purchase Details
Closed on
Mar 9, 2001
Sold by
Inman Philip Ridgeway and Inman Leslie Denise
Bought by
Lehner Mark and Rosner Judy
Home Financials for this Owner
Home Financials are based on the most recent Mortgage that was taken out on this home.
Original Mortgage
$448,000
Interest Rate
6.92%
Create a Home Valuation Report for This Property
The Home Valuation Report is an in-depth analysis detailing your home's value as well as a comparison with similar homes in the area
Home Values in the Area
Average Home Value in this Area
Purchase History
| Date | Buyer | Sale Price | Title Company |
|---|---|---|---|
| Lehner Mark K | -- | First American Title Company | |
| Lehner Mark K | -- | First American Title Company | |
| Lehner Mark K | -- | First American Title Company | |
| Lehner Mark K | -- | None Available | |
| Lehner Mark | -- | United Title Company | |
| Lehner Mark | $560,000 | Equity Title Company |
Source: Public Records
Mortgage History
| Date | Status | Borrower | Loan Amount |
|---|---|---|---|
| Open | Lehner Mark | $448,000 | |
| Previous Owner | Lehner Mark | $448,000 |
Source: Public Records
Tax History
| Year | Tax Paid | Tax Assessment Tax Assessment Total Assessment is a certain percentage of the fair market value that is determined by local assessors to be the total taxable value of land and additions on the property. | Land | Improvement |
|---|---|---|---|---|
| 2025 | $9,140 | $851,004 | $519,093 | $331,911 |
| 2024 | $9,140 | $834,318 | $508,915 | $325,403 |
| 2023 | $8,938 | $817,959 | $498,936 | $319,023 |
| 2022 | $8,765 | $801,921 | $489,153 | $312,768 |
| 2021 | $8,518 | $786,198 | $479,562 | $306,636 |
| 2020 | $8,439 | $778,137 | $474,645 | $303,492 |
| 2019 | $8,330 | $762,880 | $465,338 | $297,542 |
| 2018 | $8,202 | $747,922 | $456,214 | $291,708 |
| 2017 | $7,857 | $733,257 | $447,268 | $285,989 |
| 2016 | $7,703 | $718,880 | $438,498 | $280,382 |
| 2015 | $7,590 | $708,082 | $431,911 | $276,171 |
| 2014 | $7,427 | $694,212 | $423,450 | $270,762 |
Source: Public Records
Map
Nearby Homes
- 2018 N Lake Mead Cir
- 20101 E Clark Ave
- 1450 N Nicky Way
- 1559 N Mustang Ave
- 0 Cannon St
- 10533 Morada
- 5735 E Elsinore Ave
- 7634 E Diane Dr
- 7817 E Sandberg Ln
- 19742 Hi Top Ln S
- 10845 N Meads Ave
- 1161 N Coyote Ln
- 10052 Sycamore Cir
- 2463 N Eaton Ct
- 10041 Sycamore St
- 18811 Ridgeview Cir
- 813 S Sapphire Ln
- 11031 Meads
- 18801 Santiago Blvd
- 11082 Meads
- 6510 E Joshua Tree Ave
- 6438 E Joshua Tree Ave
- 6443 E Mabury Ave
- 6503 E Mabury Ave
- 6520 E Joshua Tree Ave
- 6517 E Mabury Ave
- 6435 E Joshua Tree Ave
- 6445 E Joshua Tree Ave
- 6509 E Joshua Tree Ave
- 6437 E Joshua Tree Ave
- 6531 E Mabury Ave
- 6415 E Mabury Ave Unit 36
- 6532 E Joshua Tree Ave
- 6519 E Joshua Tree Ave
- 6444 E Yosemite Ave
- 6533 E Joshua Tree Ave
- 6403 E Mabury Ave
- 6510 E Yosemite Ave
- 6436 E Yosemite Ave
- 1821 Orange Park Blvd
Your Personal Tour Guide
Ask me questions while you tour the home.