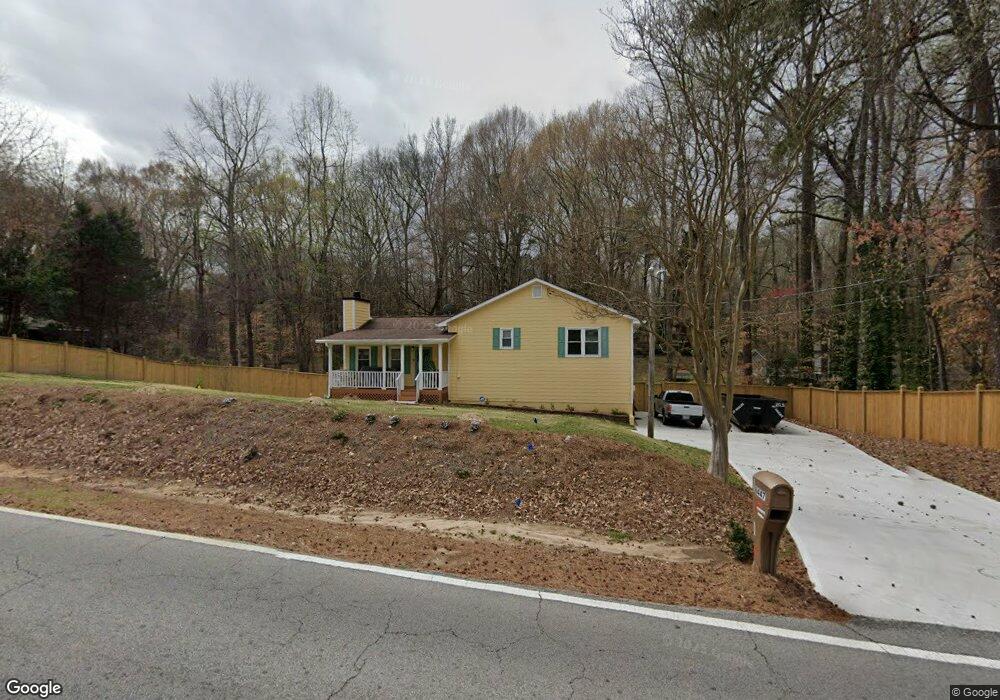
6447 N Sweetwater Rd Unit 3 Lithia Springs, GA 30122
Lithia Springs NeighborhoodEstimated Value: $212,000 - $243,000
3
Beds
2
Baths
1,206
Sq Ft
$188/Sq Ft
Est. Value
About This Home
This home is located at 6447 N Sweetwater Rd Unit 3, Lithia Springs, GA 30122 and is currently estimated at $226,178, approximately $187 per square foot. 6447 N Sweetwater Rd Unit 3 is a home located in Douglas County with nearby schools including Lithia Springs Elementary School, Turner Middle School, and Lithia Springs Comprehensive High School.
Ownership History
Date
Name
Owned For
Owner Type
Purchase Details
Closed on
Aug 9, 2016
Sold by
Touch Residence Inc
Bought by
Nelson Calvin
Current Estimated Value
Home Financials for this Owner
Home Financials are based on the most recent Mortgage that was taken out on this home.
Original Mortgage
$97,850
Outstanding Balance
$77,921
Interest Rate
3.42%
Mortgage Type
New Conventional
Estimated Equity
$148,257
Purchase Details
Closed on
Jul 19, 2013
Sold by
Sun American Holdings Llc
Bought by
Touch Residence Inc
Purchase Details
Closed on
Jan 11, 2013
Sold by
Mcghee Violet Sims
Bought by
Sun American Holdings Llc
Purchase Details
Closed on
Sep 23, 2010
Sold by
Hud-Housing Of Urban Dev
Bought by
Mcghee Violet S
Purchase Details
Closed on
May 5, 2009
Sold by
Bac Home Loans Servicing
Bought by
Hud-Housing Of Urban Dev
Purchase Details
Closed on
Feb 13, 1996
Sold by
Weaver David Lanae
Bought by
Glover Marvin Florence
Create a Home Valuation Report for This Property
The Home Valuation Report is an in-depth analysis detailing your home's value as well as a comparison with similar homes in the area
Home Values in the Area
Average Home Value in this Area
Purchase History
| Date | Buyer | Sale Price | Title Company |
|---|---|---|---|
| Nelson Calvin | $103,000 | -- | |
| Touch Residence Inc | $73,866 | -- | |
| Sun American Holdings Llc | $42,000 | -- | |
| Mcghee Violet S | -- | -- | |
| Hud-Housing Of Urban Dev | -- | -- | |
| Bac Home Loans Servicing | $67,080 | -- | |
| Glover Marvin Florence | $74,500 | -- |
Source: Public Records
Mortgage History
| Date | Status | Borrower | Loan Amount |
|---|---|---|---|
| Open | Nelson Calvin | $97,850 | |
| Closed | Glover Marvin Florence | $0 |
Source: Public Records
Tax History Compared to Growth
Tax History
| Year | Tax Paid | Tax Assessment Tax Assessment Total Assessment is a certain percentage of the fair market value that is determined by local assessors to be the total taxable value of land and additions on the property. | Land | Improvement |
|---|---|---|---|---|
| 2024 | $472 | $72,880 | $16,640 | $56,240 |
| 2023 | $472 | $72,880 | $16,640 | $56,240 |
| 2022 | $492 | $65,360 | $18,240 | $47,120 |
| 2021 | $454 | $42,120 | $11,400 | $30,720 |
| 2020 | $430 | $40,200 | $9,480 | $30,720 |
| 2019 | $341 | $39,400 | $9,480 | $29,920 |
| 2018 | $1,405 | $45,160 | $11,200 | $33,960 |
| 2017 | $1,300 | $41,000 | $11,200 | $29,800 |
| 2016 | $1,147 | $35,560 | $10,000 | $25,560 |
| 2015 | $1,132 | $34,360 | $10,000 | $24,360 |
| 2014 | $565 | $31,880 | $10,000 | $21,880 |
| 2013 | -- | $31,520 | $10,000 | $21,520 |
Source: Public Records
Map
Nearby Homes
- 6471 Ansley Blvd
- 6538 N Sweetwater Rd
- 6531 Temple St
- 6277 N Sweetwater Rd
- 6358 Gordon St
- 6435 Joanna St
- 6558 Boyd St
- 3957 Evans Dr
- 4022 Creel Dr
- 6717 S Sweetwater Rd
- 6419 Arthur Dr
- 6600 N Beulah Rd
- 3667 Humphries Hill Rd
- 3020 Ben Blvd
- 6660 Maxwell Dr
- 6503 Jackie Ln
- 3705 Tate Place
- 6163 Temple St
- 2230 Highridge Point Dr
- 6203 Temple St
- 6447 N Sweetwater Rd
- 6457 N Sweetwater Rd Unit 6
- 6457 N Sweetwater Rd
- 6435 N Sweetwater Rd Unit 2
- 236 Hazel St
- 6467 N Sweetwater Rd Unit 1
- 6456 N Sweetwater Rd
- 252 Hazel St
- 272 Hazel St
- 262 Hazel St Unit 2
- 6477 N Sweetwater Rd
- 6462 N Sweetwater Rd
- 6416 N Sweetwater Rd
- 282 Hazel St
- 0 Dale Ln
- 6468 N Sweetwater Rd
- 6468 N Sweetwater Rd Unit 19/7
- 6489 N Sweetwater Rd Unit 1
- 6489 N Sweetwater Rd
- 6429 Ansley Blvd