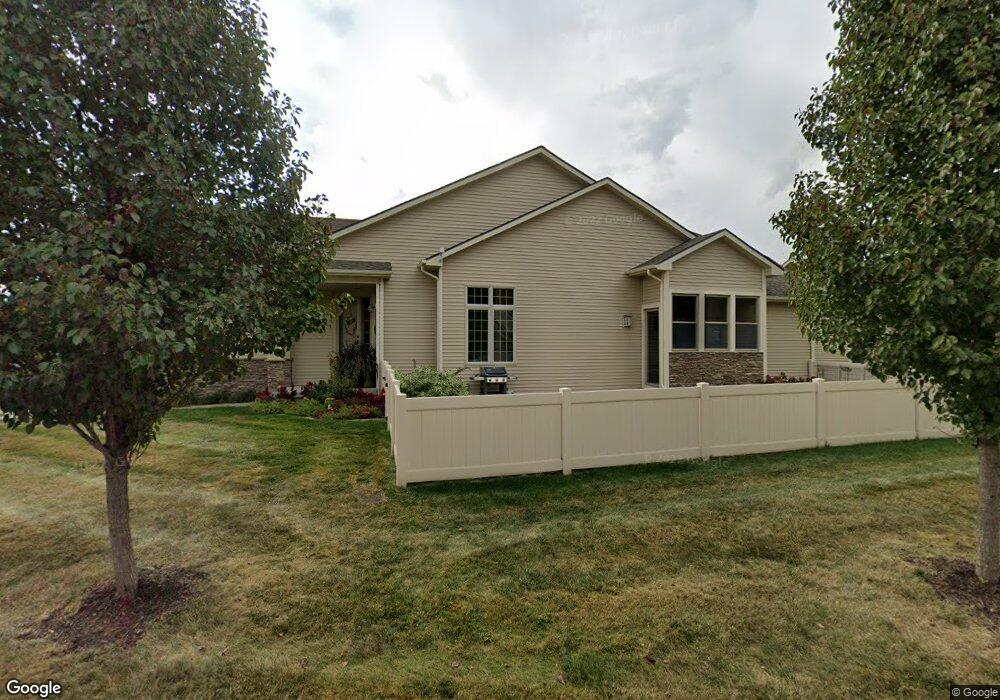
645 65th Place Unit 173 West Des Moines, IA 50266
Estimated Value: $303,293 - $367,000
2
Beds
2
Baths
1,300
Sq Ft
$261/Sq Ft
Est. Value
About This Home
This home is located at 645 65th Place Unit 173, West Des Moines, IA 50266 and is currently estimated at $338,823, approximately $260 per square foot. 645 65th Place Unit 173 is a home located in Dallas County with nearby schools including Brookview Elementary School, South Middle School, and Prairieview Middle School.
Ownership History
Date
Name
Owned For
Owner Type
Purchase Details
Closed on
Nov 16, 2022
Sold by
Glenn Joan and Glenn Richard
Bought by
Joan Glenn Revocable Trust and Glenn
Current Estimated Value
Purchase Details
Closed on
Apr 17, 2020
Sold by
Noonan Pamela M
Bought by
Pitz James P and Pitz Pamela M
Purchase Details
Closed on
Dec 15, 2017
Sold by
Glenn Matthew E and Glenn Richard W
Bought by
Glenn Joan L and Glenn Richard W
Purchase Details
Closed on
Jun 4, 2015
Sold by
Glenn Joan L
Bought by
Glenn Richard W and Glenn Mathew E
Purchase Details
Closed on
Oct 27, 2009
Sold by
Brookside Homes Llc
Bought by
Glenn Joan L
Home Financials for this Owner
Home Financials are based on the most recent Mortgage that was taken out on this home.
Original Mortgage
$107,000
Interest Rate
4.9%
Mortgage Type
New Conventional
Create a Home Valuation Report for This Property
The Home Valuation Report is an in-depth analysis detailing your home's value as well as a comparison with similar homes in the area
Home Values in the Area
Average Home Value in this Area
Purchase History
| Date | Buyer | Sale Price | Title Company |
|---|---|---|---|
| Joan Glenn Revocable Trust | -- | None Listed On Document | |
| Joan Glenn Revocable Trust | -- | None Listed On Document | |
| Joan Glenn Revocable Trust | -- | None Listed On Document | |
| Pitz James P | -- | None Available | |
| Glenn Joan L | -- | None Available | |
| Glenn Richard W | -- | None Available | |
| Glenn Joan L | $177,000 | None Available |
Source: Public Records
Mortgage History
| Date | Status | Borrower | Loan Amount |
|---|---|---|---|
| Previous Owner | Glenn Joan L | $107,000 |
Source: Public Records
Tax History Compared to Growth
Tax History
| Year | Tax Paid | Tax Assessment Tax Assessment Total Assessment is a certain percentage of the fair market value that is determined by local assessors to be the total taxable value of land and additions on the property. | Land | Improvement |
|---|---|---|---|---|
| 2024 | $4,084 | $287,130 | $70,000 | $217,130 |
| 2023 | $4,084 | $253,870 | $60,000 | $193,870 |
| 2022 | $3,878 | $227,020 | $60,000 | $167,020 |
| 2021 | $3,878 | $218,540 | $55,000 | $163,540 |
| 2020 | $3,850 | $210,250 | $55,000 | $155,250 |
| 2019 | $3,704 | $210,250 | $55,000 | $155,250 |
| 2018 | $3,704 | $193,360 | $47,500 | $145,860 |
| 2017 | $3,360 | $180,860 | $35,000 | $145,860 |
| 2016 | $3,276 | $171,950 | $35,000 | $136,950 |
| 2015 | $3,178 | $171,950 | $0 | $0 |
| 2014 | $3,084 | $171,950 | $0 | $0 |
Source: Public Records
Map
Nearby Homes
- 681 63rd St
- 6440 Ep True Pkwy Unit 3205
- 6440 Ep True Pkwy Unit 2205
- 6440 Ep True Pkwy Unit 1108
- 900 67th St Unit 805
- 6204 Aspen Dr
- 6178 Aspen Dr
- 6255 Beechtree Dr Unit 5302
- 6255 Beechtree Dr Unit 4302
- 6255 Beechtree Dr Unit 4203
- 5925 Ep True Pkwy Unit 25
- 980 65th St
- 950 67th St Unit 412
- 950 67th St Unit 321
- 6800 Ashworth Rd Unit 306
- 6374 Beechtree Dr
- 989 65th St
- 6980 Cody Dr Unit 43
- 6980 Cody Dr Unit 17
- 204 Cambridge Dr
- 645 65th Place Unit 165
- 645 65th Place Unit 167
- 645 65th Place Unit 169
- 645 65th Place Unit 175
- 645 65th Place Unit 177
- 645 65th Place Unit 179
- 645 65th Place Unit 183
- 645 65th Place Unit 185
- 645 65th Place Unit 187
- 645 65th Place Unit 189
- 645 65th Place Unit 103
- 645 65th Place Unit 105
- 645 65th Place Unit 101
- 645 65th Place Unit 151
- 645 65th Place Unit 161
- 645 65th Place Unit 166
- 645 65th Place Unit 139
- 645 65th Place Unit 147
- 645 65th Place Unit 135
- 645 65th Place Unit 125