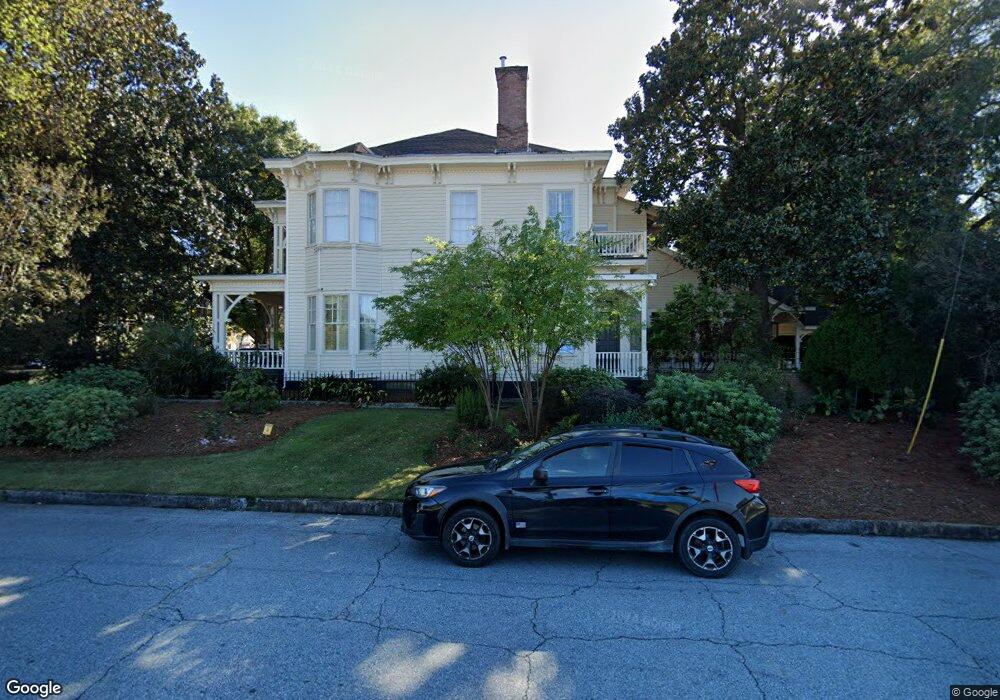
645 Broadway Columbus, GA 31901
Downtown Columbus NeighborhoodEstimated Value: $689,000 - $966,000
3
Beds
4
Baths
5,041
Sq Ft
$155/Sq Ft
Est. Value
About This Home
This home is located at 645 Broadway, Columbus, GA 31901 and is currently estimated at $783,545, approximately $155 per square foot. 645 Broadway is a home located in Muscogee County with nearby schools including Davis Elementary School, Eddy Middle School, and Jordan Vocational High School.
Ownership History
Date
Name
Owned For
Owner Type
Purchase Details
Closed on
Aug 5, 2025
Sold by
Hagler Latasca Ann
Bought by
Haley Lyman and Haley Benjamin Hatchett
Current Estimated Value
Home Financials for this Owner
Home Financials are based on the most recent Mortgage that was taken out on this home.
Original Mortgage
$21,000
Outstanding Balance
$19,304
Interest Rate
6.77%
Mortgage Type
Construction
Estimated Equity
$764,241
Purchase Details
Closed on
Oct 11, 2022
Sold by
Hagler La Tasca Ann
Bought by
Hagler La Tasca Ann and Hagler Richard C
Create a Home Valuation Report for This Property
The Home Valuation Report is an in-depth analysis detailing your home's value as well as a comparison with similar homes in the area
Home Values in the Area
Average Home Value in this Area
Purchase History
| Date | Buyer | Sale Price | Title Company |
|---|---|---|---|
| Haley Lyman | $885,000 | None Listed On Document | |
| Haley Lyman | $885,000 | None Listed On Document | |
| Hagler La Tasca Ann | -- | -- |
Source: Public Records
Mortgage History
| Date | Status | Borrower | Loan Amount |
|---|---|---|---|
| Open | Haley Lyman | $21,000 | |
| Closed | Haley Lyman | $21,000 |
Source: Public Records
Tax History
| Year | Tax Paid | Tax Assessment Tax Assessment Total Assessment is a certain percentage of the fair market value that is determined by local assessors to be the total taxable value of land and additions on the property. | Land | Improvement |
|---|---|---|---|---|
| 2025 | $5,415 | $229,564 | $45,532 | $184,032 |
| 2024 | $5,414 | $229,564 | $45,532 | $184,032 |
| 2023 | $4,754 | $229,564 | $45,532 | $184,032 |
| 2022 | $5,647 | $155,520 | $10,832 | $144,688 |
| 2021 | $5,640 | $122,616 | $10,832 | $111,784 |
| 2020 | $5,642 | $122,616 | $10,832 | $111,784 |
| 2019 | $5,661 | $122,616 | $10,832 | $111,784 |
| 2018 | $5,661 | $122,616 | $10,832 | $111,784 |
| 2017 | $5,681 | $122,616 | $10,832 | $111,784 |
| 2016 | $5,703 | $151,524 | $6,424 | $145,100 |
| 2015 | $5,710 | $151,524 | $6,424 | $145,100 |
| 2014 | $5,718 | $151,524 | $6,424 | $145,100 |
| 2013 | -- | $151,230 | $6,424 | $144,806 |
Source: Public Records
Map
Nearby Homes
- 715 Broadway
- 731 Broadway
- 715 1st Ave
- 717 1st Ave
- 731 2nd Ave
- 804 2nd Ave
- 816 2nd Ave
- 102 5th St
- 811 3rd Ave
- 508 3rd Ave
- 0 7th St
- 501 8th Ave
- 304 11th St S
- 516 Seale Rd
- 1201 Front Ave Unit 304
- 1201 Front Ave Unit 507
- 1201 Front Ave Unit 203
- 1201 Front Ave Unit 222
- 1201 Front Ave Unit 216
- 1204 1st Ave Unit 303
Your Personal Tour Guide
Ask me questions while you tour the home.