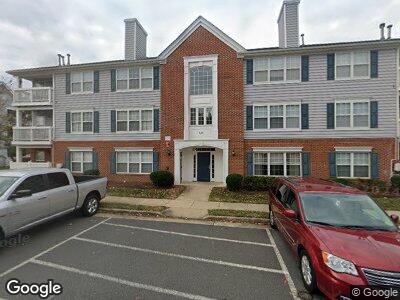
645 Constellation Square SE Unit I Leesburg, VA 20175
Estimated Value: $298,000 - $325,000
2
Beds
1
Bath
922
Sq Ft
$343/Sq Ft
Est. Value
About This Home
This home is located at 645 Constellation Square SE Unit I, Leesburg, VA 20175 and is currently estimated at $316,070, approximately $342 per square foot. 645 Constellation Square SE Unit I is a home located in Loudoun County with nearby schools including Frederick Douglass Elementary School, J. Lupton Simpson Middle School, and Loudoun County High School.
Ownership History
Date
Name
Owned For
Owner Type
Purchase Details
Closed on
Apr 22, 2002
Sold by
Wasson Joseph D
Bought by
Saleem Kamran
Current Estimated Value
Home Financials for this Owner
Home Financials are based on the most recent Mortgage that was taken out on this home.
Original Mortgage
$92,800
Outstanding Balance
$41,425
Interest Rate
7.05%
Mortgage Type
New Conventional
Estimated Equity
$272,451
Purchase Details
Closed on
Oct 26, 2000
Sold by
Mattia Charles
Bought by
Wasson Joseph D
Home Financials for this Owner
Home Financials are based on the most recent Mortgage that was taken out on this home.
Original Mortgage
$93,100
Interest Rate
7.83%
Mortgage Type
Purchase Money Mortgage
Purchase Details
Closed on
Feb 16, 1999
Sold by
Leo Chang Dev Iii Lp
Bought by
Mattia Charles and Mattia,James
Home Financials for this Owner
Home Financials are based on the most recent Mortgage that was taken out on this home.
Original Mortgage
$92,050
Interest Rate
6.75%
Mortgage Type
Purchase Money Mortgage
Create a Home Valuation Report for This Property
The Home Valuation Report is an in-depth analysis detailing your home's value as well as a comparison with similar homes in the area
Home Values in the Area
Average Home Value in this Area
Purchase History
| Date | Buyer | Sale Price | Title Company |
|---|---|---|---|
| Saleem Kamran | $116,000 | -- | |
| Wasson Joseph D | $96,000 | -- | |
| Mattia Charles | $94,180 | -- |
Source: Public Records
Mortgage History
| Date | Status | Borrower | Loan Amount |
|---|---|---|---|
| Open | Saleem Kamran | $92,800 | |
| Previous Owner | Wasson Joseph D | $93,100 | |
| Previous Owner | Mattia Charles | $92,050 |
Source: Public Records
Tax History Compared to Growth
Tax History
| Year | Tax Paid | Tax Assessment Tax Assessment Total Assessment is a certain percentage of the fair market value that is determined by local assessors to be the total taxable value of land and additions on the property. | Land | Improvement |
|---|---|---|---|---|
| 2024 | $2,437 | $281,780 | $90,000 | $191,780 |
| 2023 | $2,417 | $276,240 | $90,000 | $186,240 |
| 2022 | $2,261 | $254,010 | $65,000 | $189,010 |
| 2021 | $2,026 | $206,740 | $50,000 | $156,740 |
| 2020 | $2,111 | $203,970 | $50,000 | $153,970 |
| 2019 | $1,973 | $188,830 | $45,000 | $143,830 |
| 2018 | $1,874 | $172,680 | $45,000 | $127,680 |
| 2017 | $1,871 | $166,300 | $45,000 | $121,300 |
| 2016 | $1,894 | $165,380 | $0 | $0 |
| 2015 | $303 | $120,380 | $0 | $120,380 |
| 2014 | $289 | $113,090 | $0 | $113,090 |
Source: Public Records
Map
Nearby Homes
- 631 Constellation Square SE Unit A
- 623 Constellation Square SE Unit B
- 621 Constellation Square SE Unit C
- 673 Constellation Square SE Unit H
- 105 Nottoway St SE
- 110 Oak View Dr SE
- 105 Salem Ct SE
- 125 Oak View Dr SE
- 512 Sunset View Terrace SE Unit 302
- 505 Sunset View Terrace SE Unit 106
- 426 Ironsides Square SE
- 114 Fort Evans Rd SE Unit A
- 120 Fort Evans Rd SE Unit E
- 109 Fort Evans Rd SE Unit A
- 283 High Rail Terrace SE
- 282 Train Whistle Terrace SE
- 103 Claude Ct SE
- 259 Crescent Station Terrace SE
- 108 Roy Ct SE
- 7 First St SW
- 645 Constellation Square SE Unit 645L
- 645 Constellation Square SE Unit H
- 645 Constellation Square SE Unit K
- 645 Constellation Square SE Unit F
- 645 Constellation Square SE Unit A
- 645 Constellation Square SE Unit J
- 645 Constellation Square SE Unit G
- 645 Constellation Square SE Unit D
- 645 Constellation Square SE Unit I
- 645 Constellation Square SE Unit E
- 645 Constellation Square SE Unit C
- 645 Constellation Square SE Unit B
- 645 Constellation Square SE Unit 645G
- 645 Constellation Square SE Unit 645H
- 623 Constellation Square C Unit 623C
- 623 Constellation Square F Unit 623F
- 625 Constellation Square C Unit 625C
- 625 Constellation Square B Unit 625B
- 625 Constellation Square A Unit 625A
- 645 Constellation Square G Unit 645G