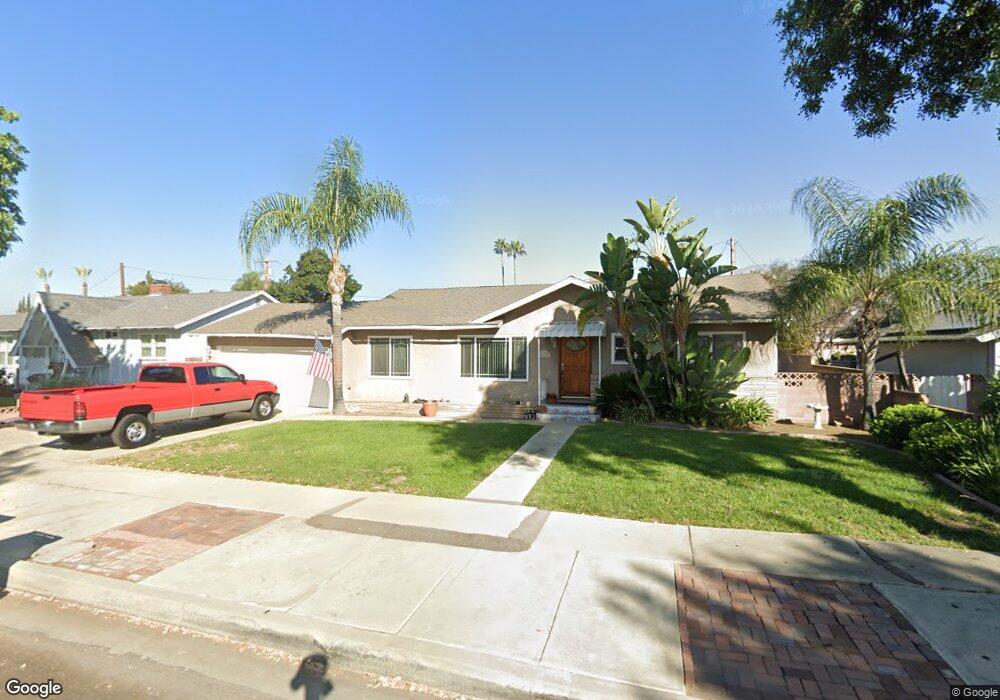
645 Emerald St Upland, CA 91786
Estimated Value: $711,000 - $739,000
3
Beds
2
Baths
1,564
Sq Ft
$465/Sq Ft
Est. Value
About This Home
This home is located at 645 Emerald St, Upland, CA 91786 and is currently estimated at $727,162, approximately $464 per square foot. 645 Emerald St is a home located in San Bernardino County with nearby schools including Citrus Elementary, Upland Junior High School, and Upland High School.
Ownership History
Date
Name
Owned For
Owner Type
Purchase Details
Closed on
Mar 3, 2021
Sold by
Stephens Mary Ann and Robert B Stephens Iii Trust
Bought by
Stephens Robert B
Current Estimated Value
Purchase Details
Closed on
Mar 5, 2013
Sold by
Stephens Robert B
Bought by
Robert B Stephens Iii Trust
Purchase Details
Closed on
Jul 6, 2001
Sold by
Lawrence Dreanne Elaine
Bought by
Stephens Robert B and Stephens Mary Ann
Home Financials for this Owner
Home Financials are based on the most recent Mortgage that was taken out on this home.
Original Mortgage
$116,900
Interest Rate
7.19%
Purchase Details
Closed on
Mar 21, 2001
Sold by
Jones Carrie Lee
Bought by
Lawrence Dreanne Elaine
Purchase Details
Closed on
Sep 14, 1994
Sold by
Purdy David J
Bought by
Lawrence Dreanne Elaine and Jones Carrie Lee
Home Financials for this Owner
Home Financials are based on the most recent Mortgage that was taken out on this home.
Original Mortgage
$142,698
Interest Rate
8.7%
Mortgage Type
Assumption
Create a Home Valuation Report for This Property
The Home Valuation Report is an in-depth analysis detailing your home's value as well as a comparison with similar homes in the area
Home Values in the Area
Average Home Value in this Area
Purchase History
| Date | Buyer | Sale Price | Title Company |
|---|---|---|---|
| Stephens Robert B | -- | None Available | |
| Robert B Stephens Iii Trust | -- | None Available | |
| Stephens Robert B | $180,000 | Stewart Title | |
| Lawrence Dreanne Elaine | -- | Stewart Title Company | |
| Lawrence Dreanne Elaine | $140,000 | Orange Coast Title Co |
Source: Public Records
Mortgage History
| Date | Status | Borrower | Loan Amount |
|---|---|---|---|
| Previous Owner | Stephens Robert B | $116,900 | |
| Previous Owner | Lawrence Dreanne Elaine | $142,698 |
Source: Public Records
Tax History
| Year | Tax Paid | Tax Assessment Tax Assessment Total Assessment is a certain percentage of the fair market value that is determined by local assessors to be the total taxable value of land and additions on the property. | Land | Improvement |
|---|---|---|---|---|
| 2025 | $6,171 | $562,864 | $200,249 | $362,615 |
| 2024 | $5,974 | $551,828 | $196,323 | $355,505 |
| 2023 | $5,883 | $541,008 | $192,474 | $348,534 |
| 2022 | $5,755 | $530,400 | $188,700 | $341,700 |
| 2021 | $2,848 | $245,666 | $136,481 | $109,185 |
| 2020 | $2,771 | $243,147 | $135,082 | $108,065 |
| 2019 | $2,762 | $238,379 | $132,433 | $105,946 |
| 2018 | $2,697 | $233,705 | $129,836 | $103,869 |
| 2017 | $2,620 | $229,122 | $127,290 | $101,832 |
| 2016 | $2,430 | $224,629 | $124,794 | $99,835 |
| 2015 | $2,375 | $221,254 | $122,919 | $98,335 |
| 2014 | $2,314 | $216,920 | $120,511 | $96,409 |
Source: Public Records
Map
Nearby Homes
- 306 S Vallejo Way
- 428 W 8th St
- 333 White Ave
- 1550 N Bonita Ct
- 340 W Caroline Ct
- 296 S Laurel Ave
- 345 Euclid Place
- 435 W 9th St Unit B3
- 181 E 8th St
- 107 N 1st Ave
- 814 W Bonnie Brae Ct
- 145 N 1st Ave
- 157 N 1st Ave
- 161 N 1st Ave
- 885 W Arrow Hwy
- 617 N Ukiah Way
- 858 W Yale St
- 144 Dorsett Ave
- 196 Eureka Place
- 603 W Harvard Place
- 663 Emerald St
- 623 Emerald St
- 638 Van Ness Ct
- 313 Van Ness Ave
- 664 Van Ness Ct
- 640 Emerald St
- 693 Emerald St
- 328 S Vallejo Way
- 668 Emerald St
- 622 Emerald St
- 314 S Vallejo Way
- 682 Emerald St
- 334 Van Ness Ave
- 346 Van Ness Ave
- 326 Van Ness Ave
- 354 Van Ness Ave
- 314 Van Ness Ave
- 698 Emerald St
- 366 Van Ness Ave
- 306 Van Ness Ave
Your Personal Tour Guide
Ask me questions while you tour the home.