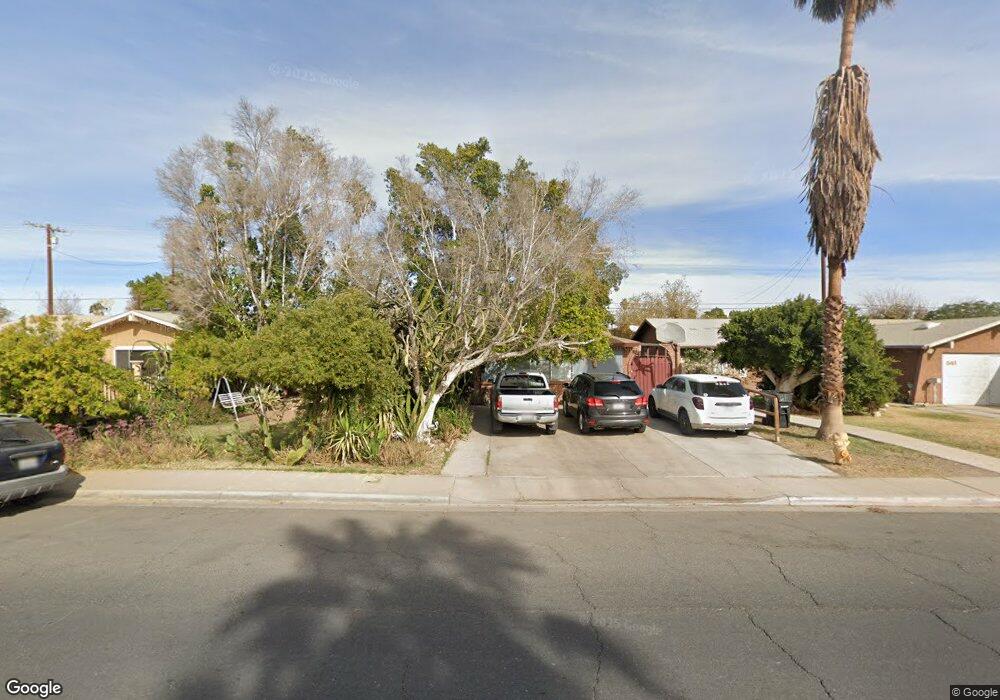
645 Grant St Calexico, CA 92231
Estimated Value: $259,000 - $395,000
3
Beds
2
Baths
1,670
Sq Ft
$201/Sq Ft
Est. Value
About This Home
This home is located at 645 Grant St, Calexico, CA 92231 and is currently estimated at $336,334, approximately $201 per square foot. 645 Grant St is a home located in Imperial County with nearby schools including Mains Elementary School, William Moreno Junior High School, and Calexico High School.
Ownership History
Date
Name
Owned For
Owner Type
Purchase Details
Closed on
Oct 31, 2018
Sold by
Barkle Martina A
Bought by
Barkle Alejandro
Current Estimated Value
Home Financials for this Owner
Home Financials are based on the most recent Mortgage that was taken out on this home.
Original Mortgage
$135,000
Outstanding Balance
$85,040
Interest Rate
4.7%
Mortgage Type
New Conventional
Estimated Equity
$251,294
Purchase Details
Closed on
Nov 13, 2002
Sold by
Barkle Martina A
Bought by
Barkle Alejandro
Purchase Details
Closed on
Nov 5, 2002
Sold by
Barkle Manuel
Bought by
Barkle Alejandro
Purchase Details
Closed on
Mar 17, 1997
Sold by
Quirrin Jose D and Quirrin Rosa
Bought by
Barkle Alejandro and Barkle Martina A
Home Financials for this Owner
Home Financials are based on the most recent Mortgage that was taken out on this home.
Original Mortgage
$89,731
Interest Rate
8.14%
Mortgage Type
FHA
Create a Home Valuation Report for This Property
The Home Valuation Report is an in-depth analysis detailing your home's value as well as a comparison with similar homes in the area
Purchase History
| Date | Buyer | Sale Price | Title Company |
|---|---|---|---|
| Barkle Alejandro | -- | Old Republic Title Company | |
| Barkle Alejandro | -- | Commonwealth Land Title Co | |
| Barkle Alejandro | -- | Commonwealth Land Title Co | |
| Barkle Alejandro | $90,000 | Commonwealth Land Title Co |
Source: Public Records
Mortgage History
| Date | Status | Borrower | Loan Amount |
|---|---|---|---|
| Open | Barkle Alejandro | $135,000 | |
| Previous Owner | Barkle Alejandro | $89,731 |
Source: Public Records
Tax History
| Year | Tax Paid | Tax Assessment Tax Assessment Total Assessment is a certain percentage of the fair market value that is determined by local assessors to be the total taxable value of land and additions on the property. | Land | Improvement |
|---|---|---|---|---|
| 2025 | $1,865 | $160,421 | $40,707 | $119,714 |
| 2023 | $1,865 | $154,193 | $39,127 | $115,066 |
| 2022 | $1,803 | $151,170 | $38,360 | $112,810 |
| 2021 | $1,748 | $148,207 | $37,608 | $110,599 |
| 2020 | $1,683 | $146,688 | $37,223 | $109,465 |
| 2019 | $1,632 | $143,813 | $36,494 | $107,319 |
| 2018 | $1,616 | $140,994 | $35,779 | $105,215 |
| 2017 | $1,498 | $138,230 | $35,078 | $103,152 |
| 2016 | $1,427 | $135,521 | $34,391 | $101,130 |
| 2015 | $1,330 | $127,000 | $32,000 | $95,000 |
| 2014 | $1,085 | $105,210 | $35,000 | $70,210 |
Source: Public Records
Map
Nearby Homes
- 652 Lincoln St
- 728 Lincoln St
- 937 Lacy Ave
- 530 W Birch St
- 904 Salvador Guilin St
- 936 Nosotros St
- 956 Salvador Guilin St
- 14 Grant St
- 1012 Desert View St
- 817 Villa Grande St
- 1040 Grant St
- 21 E 7th St
- 21 E 7th St Unit 1
- 631 Paulin Ave
- 1049 Horizon St
- 1324 River Dr
- 1325 David Navarro Ave
- 201 E Sherman St
- 1119 Imperial Ave W
- 38 Las Flores Dr
Your Personal Tour Guide
Ask me questions while you tour the home.