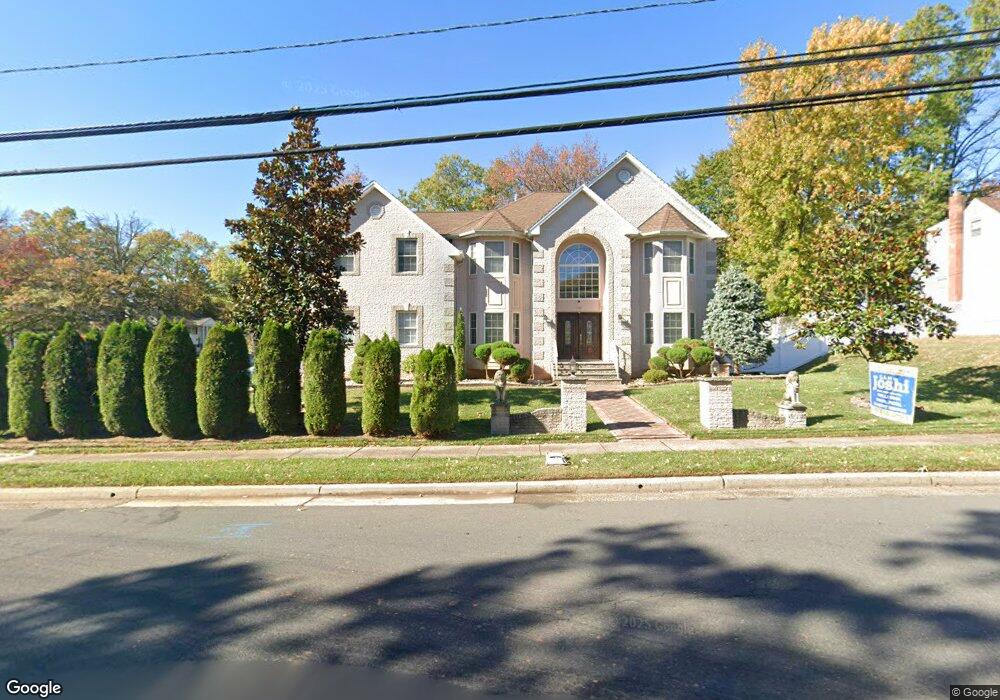
645 Grove Ave Edison, NJ 08820
Estimated Value: $1,094,000 - $1,293,000
5
Beds
4
Baths
3,800
Sq Ft
$311/Sq Ft
Est. Value
About This Home
This home is located at 645 Grove Ave, Edison, NJ 08820 and is currently estimated at $1,183,672, approximately $311 per square foot. 645 Grove Ave is a home located in Middlesex County with nearby schools including Menlo Park Elementary School, Woodrow Wilson Middle School, and J.P. Stevens High School.
Ownership History
Date
Name
Owned For
Owner Type
Purchase Details
Closed on
Jan 21, 2021
Sold by
Shah Leena and Shah Kuntal
Bought by
Shah Kuntal and Patel Pinkal
Current Estimated Value
Purchase Details
Closed on
Nov 29, 2018
Sold by
Shah Leena
Bought by
Shah Leena and Shah Kuntal
Purchase Details
Closed on
Feb 4, 2010
Sold by
Fagani Anthony and Faghani Denise M
Bought by
Gulberg Builders Llc
Create a Home Valuation Report for This Property
The Home Valuation Report is an in-depth analysis detailing your home's value as well as a comparison with similar homes in the area
Home Values in the Area
Average Home Value in this Area
Purchase History
| Date | Buyer | Sale Price | Title Company |
|---|---|---|---|
| Shah Kuntal | -- | None Available | |
| Shah Leena | -- | None Available | |
| Gulberg Builders Llc | $281,000 | Multiple |
Source: Public Records
Tax History
| Year | Tax Paid | Tax Assessment Tax Assessment Total Assessment is a certain percentage of the fair market value that is determined by local assessors to be the total taxable value of land and additions on the property. | Land | Improvement |
|---|---|---|---|---|
| 2025 | $20,419 | $343,000 | $115,200 | $227,800 |
| 2024 | $20,309 | $343,000 | $115,200 | $227,800 |
Source: Public Records
Map
Nearby Homes
- 1868 Oak Tree Rd
- 1821 Oak Tree Rd
- 48 Lynnwood Rd
- 3 Hummingbird Ln
- 177 Mundy Ave
- 33 Nottingham Rd
- 8 Montclair Ave
- 51 Adams St
- 24 Norton St
- 354 Plainfield Rd
- 10 Cutter Ave
- 73 Christie St
- 454 Plainfield Rd
- 9 Links Dr
- 3996 Park Ave
- 1123 New Dover Rd
- 1125 New Dover Rd
- 27 Mason Dr
- 12 Edgewood Rd
- 21 Williams Rd
Your Personal Tour Guide
Ask me questions while you tour the home.