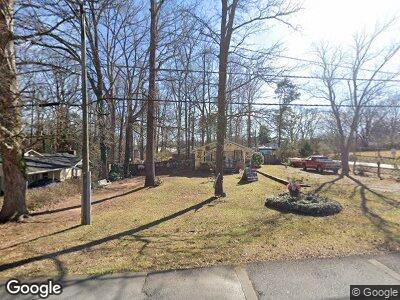
645 Landers Dr SW Mableton, GA 30126
Estimated Value: $163,000 - $269,000
2
Beds
1
Bath
756
Sq Ft
$281/Sq Ft
Est. Value
About This Home
This home is located at 645 Landers Dr SW, Mableton, GA 30126 and is currently estimated at $212,710, approximately $281 per square foot. 645 Landers Dr SW is a home located in Cobb County with nearby schools including Mableton Elementary School, Floyd Middle School, and Connection Pointe Christian Academy.
Ownership History
Date
Name
Owned For
Owner Type
Purchase Details
Closed on
May 14, 2012
Sold by
Wall Wiley F
Bought by
Wall Wiley F and Wall Joy
Current Estimated Value
Purchase Details
Closed on
Dec 19, 2006
Sold by
Pdg Enterprises Llc
Bought by
Wall Wiley F
Home Financials for this Owner
Home Financials are based on the most recent Mortgage that was taken out on this home.
Original Mortgage
$74,000
Interest Rate
6.31%
Mortgage Type
New Conventional
Purchase Details
Closed on
Apr 27, 2006
Sold by
Chappell Julie
Bought by
Pdg Ent Llc
Purchase Details
Closed on
Oct 4, 2005
Sold by
Wall Lena M
Bought by
Citibank Na
Purchase Details
Closed on
Oct 8, 1997
Sold by
Estate Of Emily M Wilbanks
Bought by
Wall Lena M
Home Financials for this Owner
Home Financials are based on the most recent Mortgage that was taken out on this home.
Original Mortgage
$45,603
Interest Rate
7.55%
Mortgage Type
FHA
Create a Home Valuation Report for This Property
The Home Valuation Report is an in-depth analysis detailing your home's value as well as a comparison with similar homes in the area
Home Values in the Area
Average Home Value in this Area
Purchase History
| Date | Buyer | Sale Price | Title Company |
|---|---|---|---|
| Wall Wiley F | -- | -- | |
| Wall Wiley F | $92,500 | -- | |
| Pdg Ent Llc | -- | -- | |
| Chappell Julie | $51,300 | -- | |
| Citibank Na | $74,586 | -- | |
| Wall Lena M | $46,000 | -- |
Source: Public Records
Mortgage History
| Date | Status | Borrower | Loan Amount |
|---|---|---|---|
| Previous Owner | Wall Wiley F | $69,783 | |
| Previous Owner | Wall Wiley F | $74,000 | |
| Previous Owner | Wall Lena M | $71,100 | |
| Previous Owner | Wall Lena M | $45,603 |
Source: Public Records
Tax History Compared to Growth
Tax History
| Year | Tax Paid | Tax Assessment Tax Assessment Total Assessment is a certain percentage of the fair market value that is determined by local assessors to be the total taxable value of land and additions on the property. | Land | Improvement |
|---|---|---|---|---|
| 2024 | $267 | $56,920 | $31,920 | $25,000 |
| 2023 | $104 | $52,780 | $35,280 | $17,500 |
| 2022 | $232 | $45,240 | $30,240 | $15,000 |
| 2021 | $225 | $42,592 | $28,560 | $14,032 |
| 2020 | $204 | $35,872 | $21,840 | $14,032 |
| 2019 | $204 | $35,872 | $21,840 | $14,032 |
| 2018 | $170 | $24,276 | $11,760 | $12,516 |
| 2017 | $153 | $24,276 | $11,760 | $12,516 |
| 2016 | $147 | $21,972 | $10,080 | $11,892 |
| 2015 | $155 | $21,484 | $10,080 | $11,404 |
| 2014 | $157 | $21,484 | $0 | $0 |
Source: Public Records
Map
Nearby Homes
- 618 Jenmarie Dr SW
- 568 Maran Ln SW
- 510 Pineland Rd SW
- 542 Oak Hills Rd SW
- 706 Briarleigh Ct SW
- 624 Moselle Dr SW
- 429 Landers Dr SW
- 426 Landers Dr SW
- 5205 Silhouette Ln SW
- 629 Moselle Dr SW
- 5370 Greenleaf Dr SW
- 5132 Silhouette Ln SW
- 5063 White Blvd SW
- 511 Fontaine Rd SW
- 371 Landers Dr SW
- 5225 Maple Valley Rd SW
- 645 Landers Dr SW
- 635 Landers Dr SW
- 665 Landers Dr SW
- 665 Barnes Dr SW Unit 2
- 665 Barnes Dr SW
- 665 Barnes Dr SW Unit 1-4
- 665 Barnes Dr SW Unit 3
- 663 Barnes Dr SW
- 625 Landers Dr SW
- 619 Jenmarie Dr SW
- 675 Landers Dr SW
- 613 Jenmarie Dr SW
- 633 Jenmarie Dr SW
- 633 Jenmarie Dr SW Unit 1
- 658 Barnes Dr SW
- 661 Barnes Dr SW
- 661 Barnes Wc Dr SW
- 609 Jenmarie Dr SW
- 668 Barnes Dr SW
- 0 Jenmarie Dr Unit 8590543