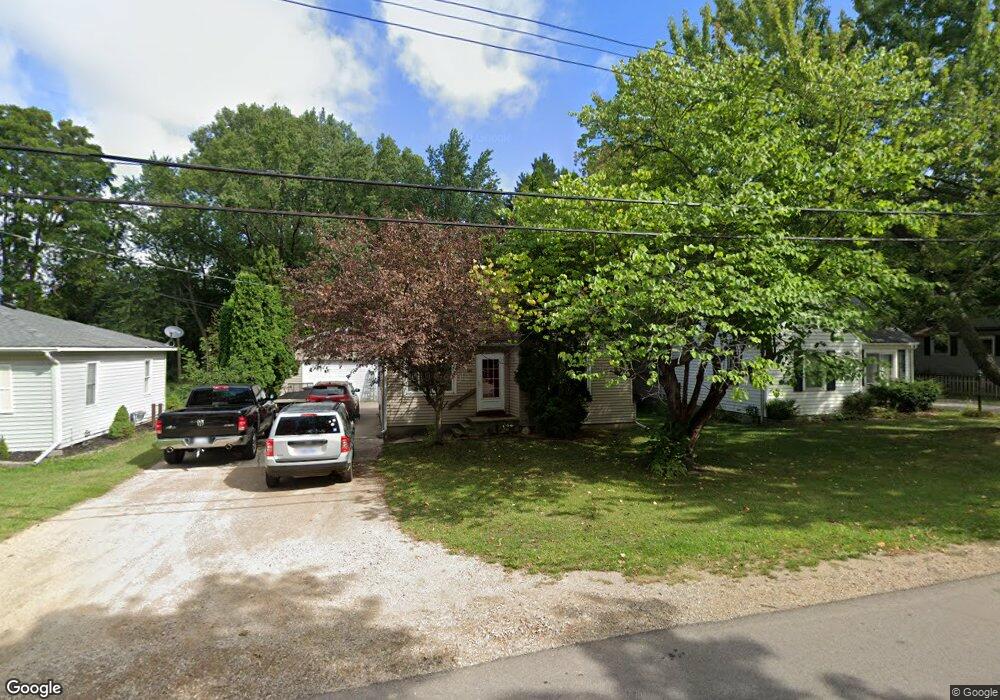
645 Louisa St Lansing, MI 48911
Southern Lansing NeighborhoodEstimated Value: $118,317 - $151,000
4
Beds
1
Bath
910
Sq Ft
$147/Sq Ft
Est. Value
About This Home
This home is located at 645 Louisa St, Lansing, MI 48911 and is currently estimated at $134,079, approximately $147 per square foot. 645 Louisa St is a home located in Ingham County with nearby schools including Kendon School, Attwood School, and Everett High School.
Ownership History
Date
Name
Owned For
Owner Type
Purchase Details
Closed on
Feb 16, 2018
Sold by
Wheeler Stephen Ross
Bought by
Martin Sean and Martin Kristen
Current Estimated Value
Home Financials for this Owner
Home Financials are based on the most recent Mortgage that was taken out on this home.
Original Mortgage
$60,541
Outstanding Balance
$51,477
Interest Rate
4.15%
Mortgage Type
FHA
Estimated Equity
$82,602
Purchase Details
Closed on
Apr 19, 2010
Sold by
Wheeler Stephen and Wheeler Jolene
Bought by
Martin Sean and Martin Kristen
Purchase Details
Closed on
Aug 20, 2002
Sold by
Wheeler Floral J
Bought by
Wheeler Stephen Ross
Create a Home Valuation Report for This Property
The Home Valuation Report is an in-depth analysis detailing your home's value as well as a comparison with similar homes in the area
Home Values in the Area
Average Home Value in this Area
Purchase History
| Date | Buyer | Sale Price | Title Company |
|---|---|---|---|
| Martin Sean | $70,000 | None Available | |
| Martin Sean | -- | None Available | |
| Wheeler Stephen Ross | -- | -- |
Source: Public Records
Mortgage History
| Date | Status | Borrower | Loan Amount |
|---|---|---|---|
| Open | Martin Sean | $60,541 |
Source: Public Records
Tax History
| Year | Tax Paid | Tax Assessment Tax Assessment Total Assessment is a certain percentage of the fair market value that is determined by local assessors to be the total taxable value of land and additions on the property. | Land | Improvement |
|---|---|---|---|---|
| 2025 | $1,876 | $56,400 | $8,300 | $48,100 |
| 2024 | $14 | $44,000 | $8,300 | $35,700 |
| 2023 | $1,761 | $39,400 | $8,300 | $31,100 |
| 2022 | $1,591 | $35,000 | $7,600 | $27,400 |
| 2021 | $1,558 | $31,300 | $6,600 | $24,700 |
| 2020 | $1,548 | $30,800 | $6,600 | $24,200 |
| 2019 | $1,482 | $26,400 | $6,600 | $19,800 |
| 2018 | $1,392 | $23,400 | $6,600 | $16,800 |
| 2017 | $1,332 | $23,400 | $6,600 | $16,800 |
| 2016 | $1,678 | $23,100 | $6,600 | $16,500 |
| 2015 | $1,678 | $22,300 | $13,254 | $9,046 |
| 2014 | $1,678 | $21,900 | $16,567 | $5,333 |
Source: Public Records
Map
Nearby Homes
- 208 E Northrup St
- 125 E Northrup St
- 115 E Claremore Dr
- 1115 Shirley St
- 5008 Southgate Ave
- 1109 Barr Ave
- 205 E Jolly Rd Unit 6
- 6246 Gardenia Ave
- 4719 S Pennsylvania Ave
- 5267 Crocus Ave
- 6264 Beechfield Dr Unit 97
- 201 E Syringa Dr
- 1101 Kendon Dr
- 6300 Beechfield Dr Unit 87
- 5009 Kessler Dr
- 4608 Alpha St
- 419 W Jolly Rd
- 6321 Beechfield Dr Unit 37
- 6317 Beechfield Dr Unit 49
- 6331 Beechfield Dr Unit 42
Your Personal Tour Guide
Ask me questions while you tour the home.