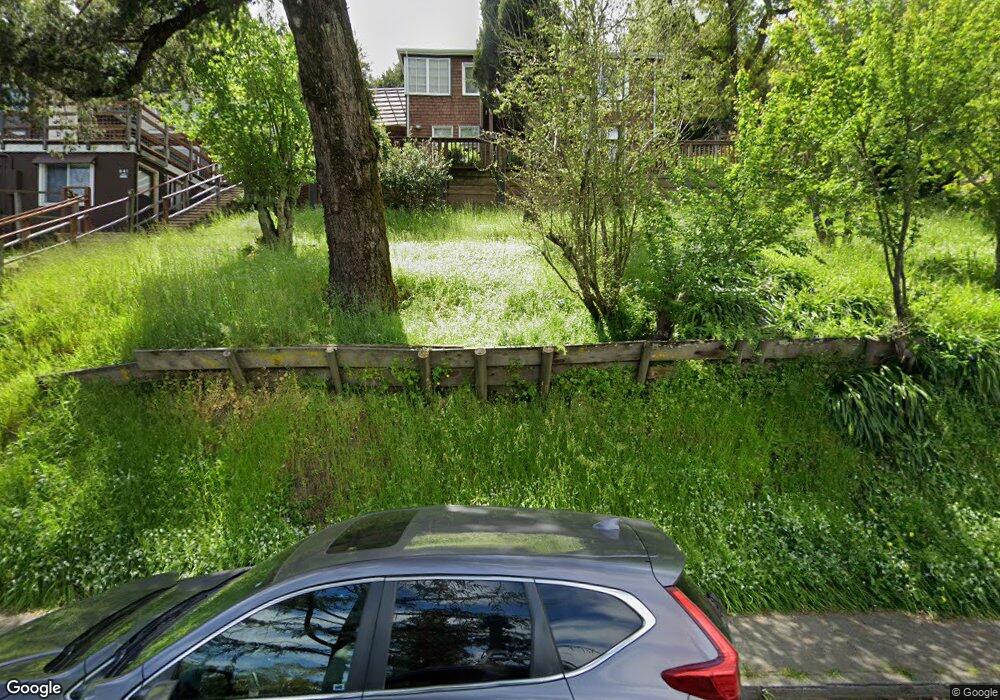
645 Magnolia Ave Larkspur, CA 94939
The Loop NeighborhoodEstimated Value: $765,000 - $1,704,000
2
Beds
1
Bath
1,195
Sq Ft
$1,129/Sq Ft
Est. Value
About This Home
This home is located at 645 Magnolia Ave, Larkspur, CA 94939 and is currently estimated at $1,349,534, approximately $1,129 per square foot. 645 Magnolia Ave is a home located in Marin County with nearby schools including Neil Cummins Elementary School, The Cove School, and Hall Middle School.
Ownership History
Date
Name
Owned For
Owner Type
Purchase Details
Closed on
Feb 18, 2021
Sold by
Speer Therese V and Ryan Therese V
Bought by
Speer Therese V and Speer Therese V
Current Estimated Value
Purchase Details
Closed on
Mar 18, 2019
Sold by
Ryan Philip Kurtis and Speer Therese V
Bought by
Speer Therese V
Home Financials for this Owner
Home Financials are based on the most recent Mortgage that was taken out on this home.
Original Mortgage
$335,000
Outstanding Balance
$293,316
Interest Rate
4.2%
Mortgage Type
New Conventional
Estimated Equity
$1,056,218
Purchase Details
Closed on
Jul 21, 1997
Sold by
Ryan Philip K
Bought by
Ryan Philip Kurtis and Ryan Therese
Home Financials for this Owner
Home Financials are based on the most recent Mortgage that was taken out on this home.
Original Mortgage
$50,000
Interest Rate
7.57%
Mortgage Type
Credit Line Revolving
Create a Home Valuation Report for This Property
The Home Valuation Report is an in-depth analysis detailing your home's value as well as a comparison with similar homes in the area
Home Values in the Area
Average Home Value in this Area
Purchase History
| Date | Buyer | Sale Price | Title Company |
|---|---|---|---|
| Speer Therese V | -- | None Available | |
| Speer Therese V | -- | Title Source Inc | |
| Ryan Philip Kurtis | -- | -- |
Source: Public Records
Mortgage History
| Date | Status | Borrower | Loan Amount |
|---|---|---|---|
| Open | Speer Therese V | $335,000 | |
| Previous Owner | Ryan Philip Kurtis | $50,000 |
Source: Public Records
Tax History Compared to Growth
Tax History
| Year | Tax Paid | Tax Assessment Tax Assessment Total Assessment is a certain percentage of the fair market value that is determined by local assessors to be the total taxable value of land and additions on the property. | Land | Improvement |
|---|---|---|---|---|
| 2025 | $6,945 | $286,738 | $133,857 | $152,881 |
| 2024 | $6,945 | $281,116 | $131,233 | $149,883 |
| 2023 | $6,758 | $275,604 | $128,660 | $146,944 |
| 2022 | $6,579 | $270,200 | $126,137 | $144,063 |
| 2021 | $6,259 | $264,903 | $123,664 | $141,239 |
| 2020 | $6,237 | $262,187 | $122,396 | $139,791 |
| 2019 | $5,962 | $257,047 | $119,997 | $137,050 |
| 2018 | $5,477 | $252,007 | $117,644 | $134,363 |
| 2017 | $5,324 | $247,067 | $115,338 | $131,729 |
| 2016 | $5,080 | $242,222 | $113,076 | $129,146 |
| 2015 | $4,814 | $238,584 | $111,378 | $127,206 |
| 2014 | $4,573 | $233,911 | $109,196 | $124,715 |
Source: Public Records
Map
Nearby Homes
- 310 Larkspur Plaza Dr
- 505 Larkspur Plaza Dr Unit 9
- 24 Boardwalk One
- 50 Via Belardo Unit 12
- 320 Via Casitas Unit 109
- 500 Via Hidalgo
- 100 Black Log Rd
- 128 Ridgecrest Rd
- 72 Lucky Dr
- 69 Corte Madera Ave
- 47 Redwood Ave Unit 17
- 61 Pixley Ave Unit 3
- 16 Edna Ct
- 666 Redwood Ave
- 9 Fay Dr
- 2130 Redwood Hwy Unit F5
- 2130 Redwood Hwy Unit G6
- 321 N Almenar Dr
- 216 Evergreen Dr
- 19 Mliss Ln
- 639 Magnolia Ave
- 641 Magnolia Ave Unit 2
- 641 Magnolia Ave
- 647 Magnolia Ave Unit A
- 11 Opal St
- 653 Magnolia Ave Unit 2
- 653 Magnolia Ave
- 653 Magnolia Ave
- 653 Magnolia Ave Unit 1
- 633 Magnolia Ave
- 655 Magnolia Ave
- 627 Magnolia Ave
- 68 Cross Creek Place
- 70 Cross Creek Place
- 66 Cross Creek Place
- 42 Cedar Ave
- 72 Cross Creek Place
- 659 Magnolia Ave
- 74 Cross Creek Place
- 64 Cross Creek Place