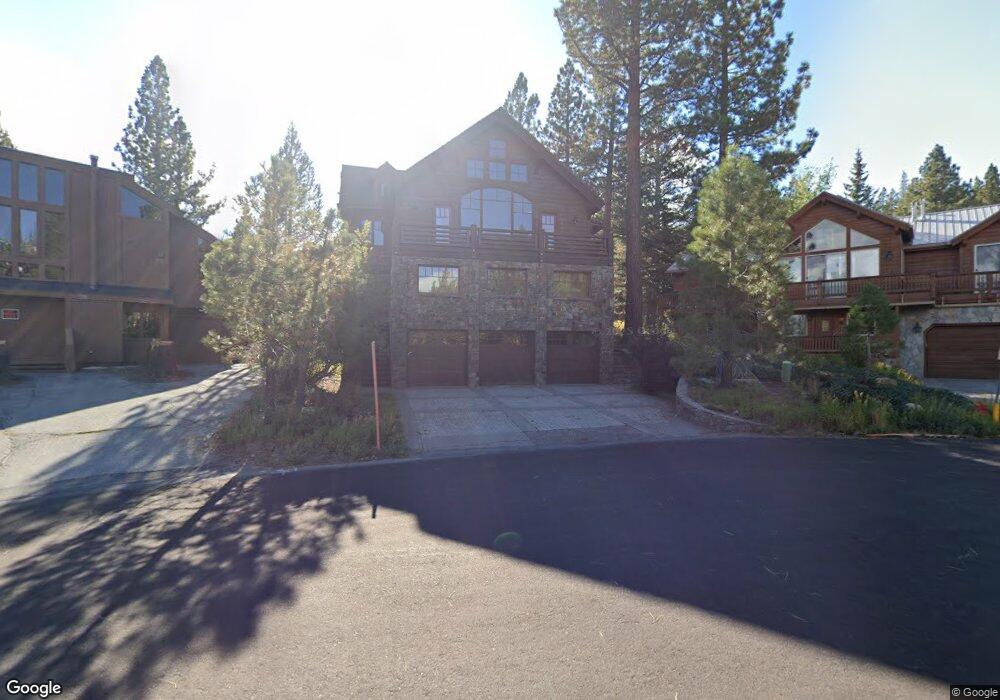
645 Monterey Pine Rd Unit Mammoth Vista I, Lot Mammoth Lakes, CA 93546
Estimated Value: $2,807,058 - $3,222,000
5
Beds
5
Baths
4,700
Sq Ft
$659/Sq Ft
Est. Value
About This Home
This home is located at 645 Monterey Pine Rd Unit Mammoth Vista I, Lot, Mammoth Lakes, CA 93546 and is currently estimated at $3,095,015, approximately $658 per square foot. 645 Monterey Pine Rd Unit Mammoth Vista I, Lot is a home located in Mono County with nearby schools including Mammoth Elementary School, Mammoth Middle School, and Mammoth High School.
Ownership History
Date
Name
Owned For
Owner Type
Purchase Details
Closed on
Jul 27, 2018
Sold by
Goldman Andrew Doniger and Goldman Lisa Gabrielle
Bought by
Mandeville Holdings Llc
Current Estimated Value
Purchase Details
Closed on
Nov 11, 2008
Sold by
Hooper John W
Bought by
Goldman Andrew Doniger and Goldman Lisa Gabrielle
Purchase Details
Closed on
Jun 16, 2005
Sold by
Ives Jonathan D and Ives Sarah L
Bought by
Hooper John W
Home Financials for this Owner
Home Financials are based on the most recent Mortgage that was taken out on this home.
Original Mortgage
$250,000
Interest Rate
5.72%
Mortgage Type
Unknown
Purchase Details
Closed on
Mar 18, 2005
Sold by
Hooper Tammy Lynn Noel
Bought by
Hooper John W
Create a Home Valuation Report for This Property
The Home Valuation Report is an in-depth analysis detailing your home's value as well as a comparison with similar homes in the area
Home Values in the Area
Average Home Value in this Area
Purchase History
| Date | Buyer | Sale Price | Title Company |
|---|---|---|---|
| Mandeville Holdings Llc | $2,117,500 | Inyo Mono Title Co | |
| Goldman Andrew Doniger | -- | Inyo Mono Title Company | |
| Hooper John W | $1,250,000 | Inyo Mono Title Company | |
| Hooper John W | -- | Inyo Mono Title Company |
Source: Public Records
Mortgage History
| Date | Status | Borrower | Loan Amount |
|---|---|---|---|
| Previous Owner | Hooper John W | $250,000 |
Source: Public Records
Tax History Compared to Growth
Tax History
| Year | Tax Paid | Tax Assessment Tax Assessment Total Assessment is a certain percentage of the fair market value that is determined by local assessors to be the total taxable value of land and additions on the property. | Land | Improvement |
|---|---|---|---|---|
| 2024 | $25,897 | $2,315,790 | $546,820 | $1,768,970 |
| 2023 | $25,897 | $2,270,384 | $536,099 | $1,734,285 |
| 2022 | $25,593 | $2,225,868 | $525,588 | $1,700,280 |
| 2021 | $24,870 | $2,182,225 | $515,283 | $1,666,942 |
| 2020 | $24,680 | $2,159,850 | $510,000 | $1,649,850 |
| 2019 | $24,127 | $2,117,500 | $500,000 | $1,617,500 |
| 2018 | $35,687 | $3,055,784 | $1,131,770 | $1,924,014 |
| 2017 | $32,938 | $2,995,868 | $1,109,579 | $1,886,289 |
| 2016 | $32,380 | $2,937,126 | $1,087,823 | $1,849,303 |
| 2015 | $32,230 | $2,893,008 | $1,071,483 | $1,821,525 |
| 2014 | $31,709 | $2,836,339 | $1,050,495 | $1,785,844 |
Source: Public Records
Map
Nearby Homes
- 4000 Meridian Blvd Unit 436
- 2022 Lodestar Dr Unit 10
- 3253 Meridian Blvd Unit B-235
- 3253 Meridian Blvd Unit 246
- 3253 Meridian Blvd Unit 214
- 3253 Meridian Blvd Unit 208
- 98 Tyrol Ln Unit 304
- 98 Tyrol Ln Unit 306
- 4 Kelley Rd Unit 1
- 4 Kelley Rd Unit 5
- 44 Tyrol Ln Unit 209
- 44 Tyrol Ln Unit 213
- 64 Juniper Rd Unit 29
- 37 Bridges Ln
- 37 Bridges Ln Unit Lot
- 622 Majestic Pines Dr Unit 11
- 865 Majestic Pines Dr Unit 306
- 865 Majestic Pines Dr Unit 318
- 33 Bridges Ln Unit 16
- 19 Villa Vista #5 Dr Unit 5
- 645 Monterey Pine Rd Unit 28
- 645 Monterey Pine Rd
- 645 Monterey Pine Rd Unit Mammoth Vista I
- 655 Monterey Pine Rd
- 635 Monterey Pine Rd Unit 29
- 635 Monterey Pine Rd
- 665 Monterey Pine Rd Unit 26
- 665 Monterey Pine Rd
- 627 Monterey Pine Rd Unit MVI Lot 30
- 618 Monterey Pine Rd
- 619 Monterey Pine Rd
- 670 Monterey Pine Rd
- 660 Monterey Pine Rd
- 608 Monterey Pine Rd Unit 22
- 608 Monterey Pine Rd
- 609 Monterey Pine Rd
- 60 Pineknoll Place Unit 10
- 60 Pineknoll Place Unit Mammoth Vista I, Lot
- 1161 Majestic Pines Dr
- 55 Pine Knoll Place