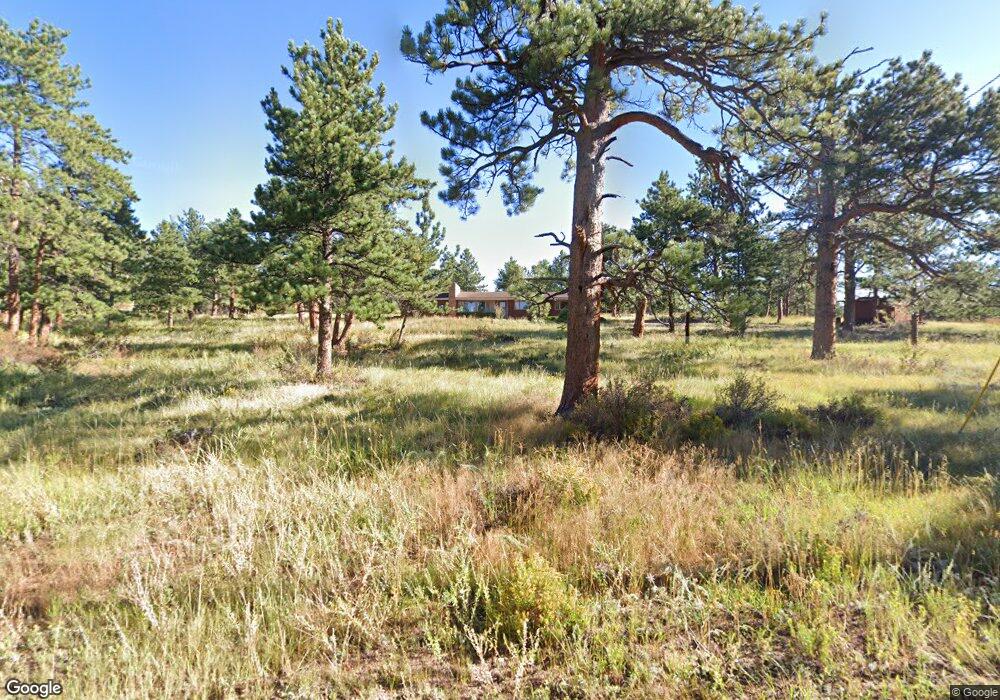
645 Pinewood Ln Estes Park, CO 80517
Estimated Value: $774,000 - $990,000
2
Beds
4
Baths
2,045
Sq Ft
$437/Sq Ft
Est. Value
About This Home
This home is located at 645 Pinewood Ln, Estes Park, CO 80517 and is currently estimated at $893,033, approximately $436 per square foot. 645 Pinewood Ln is a home located in Larimer County with nearby schools including Estes Park K-5 School, Estes Park Options School, and Estes Park Middle School.
Ownership History
Date
Name
Owned For
Owner Type
Purchase Details
Closed on
Apr 15, 2025
Sold by
Hebert Bonnie
Bought by
Petrocine Ernest J
Current Estimated Value
Purchase Details
Closed on
Oct 18, 2023
Sold by
Woolsey Linda L
Bought by
Petrocine Ernest J
Purchase Details
Closed on
Jun 6, 2023
Sold by
Petrocine Cora E
Bought by
Petrocine Ernest J and Woolsey Linda L
Purchase Details
Closed on
Jul 10, 2007
Sold by
Petrocine Cora E
Bought by
Petrocine Cora E
Purchase Details
Closed on
Sep 1, 1992
Sold by
Petrocine Norman T Trustee
Bought by
Petrocine Cora E Trustee
Purchase Details
Closed on
Jan 26, 1976
Sold by
Petrocine Cora E
Bought by
Petrocine Norman T and Petrocine Cora E
Purchase Details
Closed on
Nov 14, 1950
Sold by
Fries Elmore A and Fries Maudie E
Bought by
Petrocine Norman T and Petrocine Cora E
Create a Home Valuation Report for This Property
The Home Valuation Report is an in-depth analysis detailing your home's value as well as a comparison with similar homes in the area
Home Values in the Area
Average Home Value in this Area
Purchase History
| Date | Buyer | Sale Price | Title Company |
|---|---|---|---|
| Petrocine Ernest J | -- | None Listed On Document | |
| Petrocine Ernest J | -- | None Listed On Document | |
| Petrocine Ernest J | -- | None Listed On Document | |
| Petrocine Cora E | -- | None Available | |
| Petrocine Cora E Trustee | -- | -- | |
| Petrocine Norman T | -- | -- | |
| Petrocine Norman T | $2,000 | -- |
Source: Public Records
Tax History Compared to Growth
Tax History
| Year | Tax Paid | Tax Assessment Tax Assessment Total Assessment is a certain percentage of the fair market value that is determined by local assessors to be the total taxable value of land and additions on the property. | Land | Improvement |
|---|---|---|---|---|
| 2025 | $3,687 | $54,022 | $19,765 | $34,257 |
| 2024 | $3,624 | $54,022 | $19,765 | $34,257 |
| 2022 | $2,652 | $41,679 | $13,205 | $28,474 |
| 2021 | $2,723 | $42,879 | $13,585 | $29,294 |
| 2020 | $2,731 | $42,536 | $12,799 | $29,737 |
| 2019 | $2,716 | $42,536 | $12,799 | $29,737 |
| 2018 | $1,861 | $30,708 | $12,096 | $18,612 |
| 2017 | $1,871 | $30,708 | $12,096 | $18,612 |
| 2016 | $1,813 | $32,103 | $13,134 | $18,969 |
| 2015 | $1,832 | $32,100 | $13,130 | $18,970 |
| 2014 | $1,428 | $27,260 | $12,740 | $14,520 |
Source: Public Records
Map
Nearby Homes
- 930 Highacres Dr
- 2175 Carriage Dr
- 407 Pawnee Dr
- 2319 Spruce Ave
- 659 Peak View Dr
- 384 Prospect Estates Ct
- 1692 Prospect Estates Dr
- 2441 Spruce Ave
- 2408 Longview Dr
- 303 Curry Dr
- 1341 Tall Pines Dr
- 1033 Tranquil Ln
- 0 Governors Ln Unit 1035838
- 275 Solomon Dr
- 1062 Pine Knoll Dr
- 197 Curry Dr
- 619 Whispering Pines Dr
- 151 Curry Dr
- 419 Whispering Pines Dr
- 2516 Pine Meadow Dr