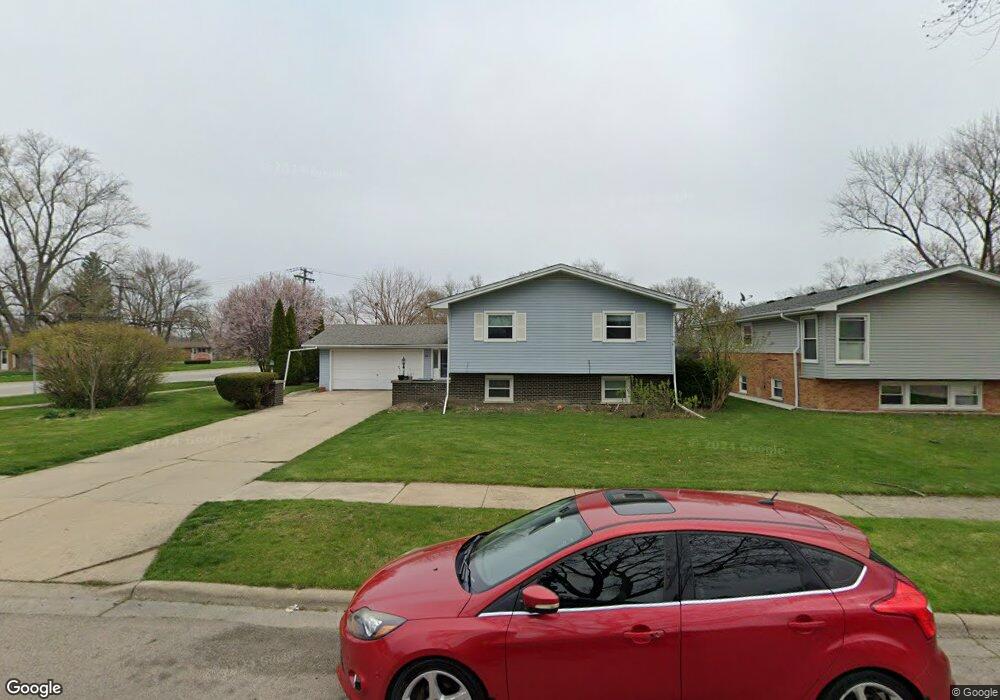
645 Seneca Dr Unit 2 Aurora, IL 60506
Blackhawk NeighborhoodEstimated Value: $337,000 - $351,000
5
Beds
2
Baths
2,590
Sq Ft
$133/Sq Ft
Est. Value
About This Home
This home is located at 645 Seneca Dr Unit 2, Aurora, IL 60506 and is currently estimated at $344,512, approximately $133 per square foot. 645 Seneca Dr Unit 2 is a home located in Kane County with nearby schools including Mccleery Elementary School, Jefferson Middle School, and West Aurora High School.
Ownership History
Date
Name
Owned For
Owner Type
Purchase Details
Closed on
May 4, 2022
Sold by
Nevarez Rosa
Bought by
Nevarez Rosa M and Sanchez Antonio
Current Estimated Value
Home Financials for this Owner
Home Financials are based on the most recent Mortgage that was taken out on this home.
Original Mortgage
$135,087
Outstanding Balance
$127,834
Interest Rate
4.83%
Mortgage Type
New Conventional
Estimated Equity
$216,678
Purchase Details
Closed on
Sep 23, 2005
Sold by
Nevarez Rosa and Sanchez Antonio
Bought by
Nevarez Rosa
Home Financials for this Owner
Home Financials are based on the most recent Mortgage that was taken out on this home.
Original Mortgage
$144,000
Interest Rate
5.93%
Mortgage Type
New Conventional
Purchase Details
Closed on
Jun 22, 2000
Sold by
Swickert Robert H and Dettinger Swickert Kari L
Bought by
Sanchez Antonio and Nevarez Rosa
Home Financials for this Owner
Home Financials are based on the most recent Mortgage that was taken out on this home.
Original Mortgage
$138,700
Interest Rate
8.33%
Purchase Details
Closed on
Jun 18, 1997
Sold by
Burch Gary C and Burch Darlene A
Bought by
Swickert Robert H and Dettinger Swickert Kari L
Create a Home Valuation Report for This Property
The Home Valuation Report is an in-depth analysis detailing your home's value as well as a comparison with similar homes in the area
Home Values in the Area
Average Home Value in this Area
Purchase History
| Date | Buyer | Sale Price | Title Company |
|---|---|---|---|
| Nevarez Rosa M | -- | None Listed On Document | |
| Nevarez Rosa | -- | -- | |
| Sanchez Antonio | $146,000 | Chicago Title Insurance Co | |
| Swickert Robert H | $127,000 | Law Title Insurance Co |
Source: Public Records
Mortgage History
| Date | Status | Borrower | Loan Amount |
|---|---|---|---|
| Open | Nevarez Rosa M | $135,087 | |
| Previous Owner | Nevarez Rosa | $144,000 | |
| Previous Owner | Sanchez Antonio | $138,700 |
Source: Public Records
Tax History
| Year | Tax Paid | Tax Assessment Tax Assessment Total Assessment is a certain percentage of the fair market value that is determined by local assessors to be the total taxable value of land and additions on the property. | Land | Improvement |
|---|---|---|---|---|
| 2024 | $4,442 | $88,440 | $13,876 | $74,564 |
| 2023 | $6,083 | $79,021 | $12,398 | $66,623 |
| 2022 | $5,851 | $72,099 | $11,312 | $60,787 |
| 2021 | $6,530 | $77,472 | $10,532 | $66,940 |
| 2020 | $6,175 | $71,960 | $9,783 | $62,177 |
| 2019 | $6,385 | $71,298 | $9,064 | $62,234 |
| 2018 | $5,809 | $64,186 | $8,384 | $55,802 |
| 2017 | $6,017 | $64,465 | $7,725 | $56,740 |
| 2016 | $5,216 | $55,102 | $6,622 | $48,480 |
| 2015 | $5,123 | $48,031 | $5,694 | $42,337 |
| 2014 | $5,123 | $44,498 | $5,233 | $39,265 |
| 2013 | $5,123 | $44,380 | $5,674 | $38,706 |
Source: Public Records
Map
Nearby Homes
- 1358 Monomoy St Unit A
- 1351 Monomoy St Unit D
- 1039 S Pleasure Ct
- 811 N Randall Rd Unit B
- 742 N Glenwood Place
- 1421 Heather Dr
- 833 N Randall Rd Unit C4
- 1387 S Glen Cir Unit D
- 833 Sheldon Ave
- 1034 W New York St
- 950 Spruce St
- 735 Westgate Dr
- 847 Foran Ln
- 115 N Western Ave
- 930 W New York St Unit 932
- 231 W Downer Place
- 106 Hillwood Place Unit 5A
- 1229 Yellowpine Dr
- 220 N Rosedale Ave
- 807 Spruce St
- 639 Seneca Dr
- 1236 W Illinois Ave Unit 2
- 638 Iroquois Dr Unit 2
- 644 Seneca Dr
- 632 Iroquois Dr
- 629 Seneca Dr
- 636 Seneca Dr
- 626 Iroquois Dr Unit 2
- 1306 W Illinois Ave
- 625 Seneca Dr
- 1305 Monona Ave Unit 3
- 620 Iroquois Dr
- 645 Iroquois Dr
- 641 Iroquois Dr
- 1310 W Illinois Ave
- 635 Iroquois Dr
- 621 Seneca Dr
- 614 Iroquois Dr
- 1309 Monona Ave
- 1221 Ottawa Ave
Your Personal Tour Guide
Ask me questions while you tour the home.