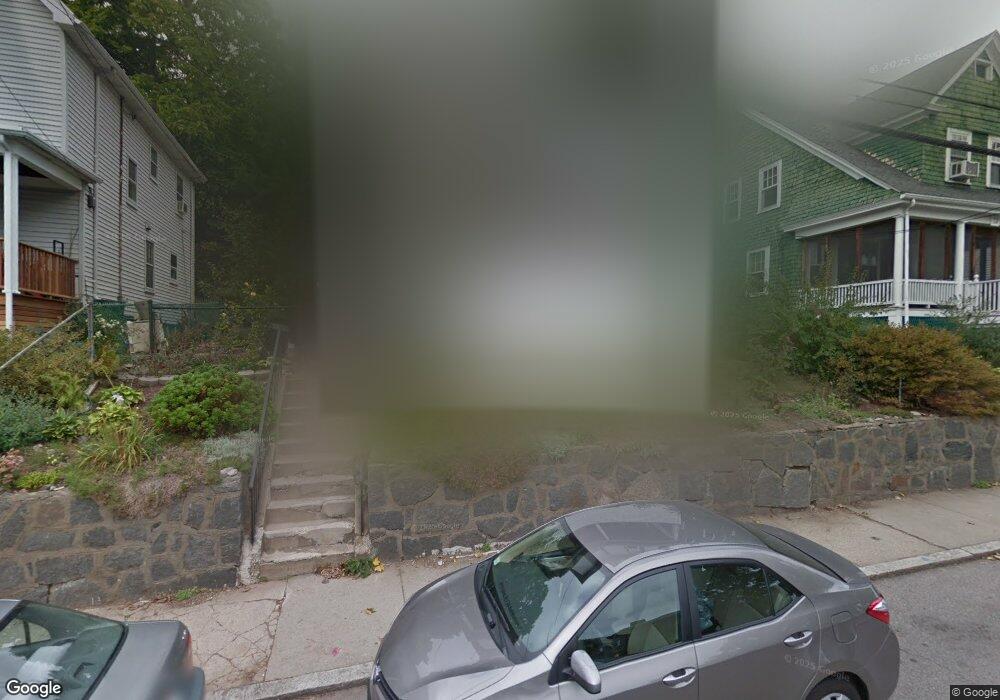
645 South St Roslindale, MA 02131
Roslindale NeighborhoodEstimated Value: $726,228 - $898,000
3
Beds
2
Baths
1,482
Sq Ft
$536/Sq Ft
Est. Value
About This Home
This home is located at 645 South St, Roslindale, MA 02131 and is currently estimated at $794,057, approximately $535 per square foot. 645 South St is a home located in Suffolk County with nearby schools including Brooke Charter School Roslindale, The Croft School - Jamaica Plain, and Sacred Heart STEM School.
Ownership History
Date
Name
Owned For
Owner Type
Purchase Details
Closed on
Apr 5, 2022
Sold by
Foley Rosalie N and Foley Nelly R
Bought by
Foley Rosalie N and Vonvogler Michelle
Current Estimated Value
Purchase Details
Closed on
Jan 27, 2011
Sold by
Foley Nelly R and Foley John C
Bought by
Boston City Of
Create a Home Valuation Report for This Property
The Home Valuation Report is an in-depth analysis detailing your home's value as well as a comparison with similar homes in the area
Home Values in the Area
Average Home Value in this Area
Purchase History
| Date | Buyer | Sale Price | Title Company |
|---|---|---|---|
| Foley Rosalie N | -- | None Available | |
| Boston City Of | $1,795 | -- |
Source: Public Records
Mortgage History
| Date | Status | Borrower | Loan Amount |
|---|---|---|---|
| Previous Owner | Boston City Of | $180,000 | |
| Previous Owner | Boston City Of | $151,000 | |
| Previous Owner | Boston City Of | $68,500 |
Source: Public Records
Tax History Compared to Growth
Tax History
| Year | Tax Paid | Tax Assessment Tax Assessment Total Assessment is a certain percentage of the fair market value that is determined by local assessors to be the total taxable value of land and additions on the property. | Land | Improvement |
|---|---|---|---|---|
| 2025 | $7,134 | $616,100 | $241,300 | $374,800 |
| 2024 | $6,305 | $578,400 | $210,700 | $367,700 |
| 2023 | $6,465 | $602,000 | $210,700 | $391,300 |
| 2022 | $5,848 | $537,500 | $188,100 | $349,400 |
| 2021 | $5,735 | $537,500 | $188,100 | $349,400 |
| 2020 | $4,329 | $409,900 | $173,200 | $236,700 |
| 2019 | $4,000 | $379,500 | $147,100 | $232,400 |
| 2018 | $3,685 | $351,600 | $147,100 | $204,500 |
| 2017 | $3,723 | $351,600 | $147,100 | $204,500 |
| 2016 | $3,754 | $341,300 | $147,100 | $194,200 |
| 2015 | $3,748 | $309,500 | $127,700 | $181,800 |
| 2014 | $3,540 | $281,400 | $127,700 | $153,700 |
Source: Public Records
Map
Nearby Homes
- 620 South St
- 4031 Washington St
- 108 Florence St Unit 3
- 108 Florence St Unit 1
- 108 Florence St Unit 4
- 4012 Washington St
- 19 Delford St
- 19 Delford St Unit 1
- 187 Florence St Unit 2L
- 67 Cummins Hwy Unit 101
- 15 S Fairview St Unit 3
- 348-350 Hyde Park Ave Unit 2
- 65 Birch St Unit 3
- 2 Weld Hill St Unit PH2
- 79 Robert St Unit 3
- 18-20 Northbourne Rd Unit 18
- 27 Rowe St
- 50 Southbourne Rd
- 36 Neponset Ave Unit 1
- 103 Belgrade Ave Unit 2
- 643 South St
- 647 South St
- 649 South St
- 641 South St
- 646 South St Unit B
- 651 South St
- 644 South St
- 648 South St Unit 1
- 648 South St Unit 2
- 650 South St
- 650 South St Unit 3
- 650 South St Unit 1
- 650 South St Unit 2
- 637 South St
- 640 South St
- 653 South St Unit 2
- 653 South St Unit 1
- 652 South St
- 652 South St Unit 2
- 652 South St Unit 1