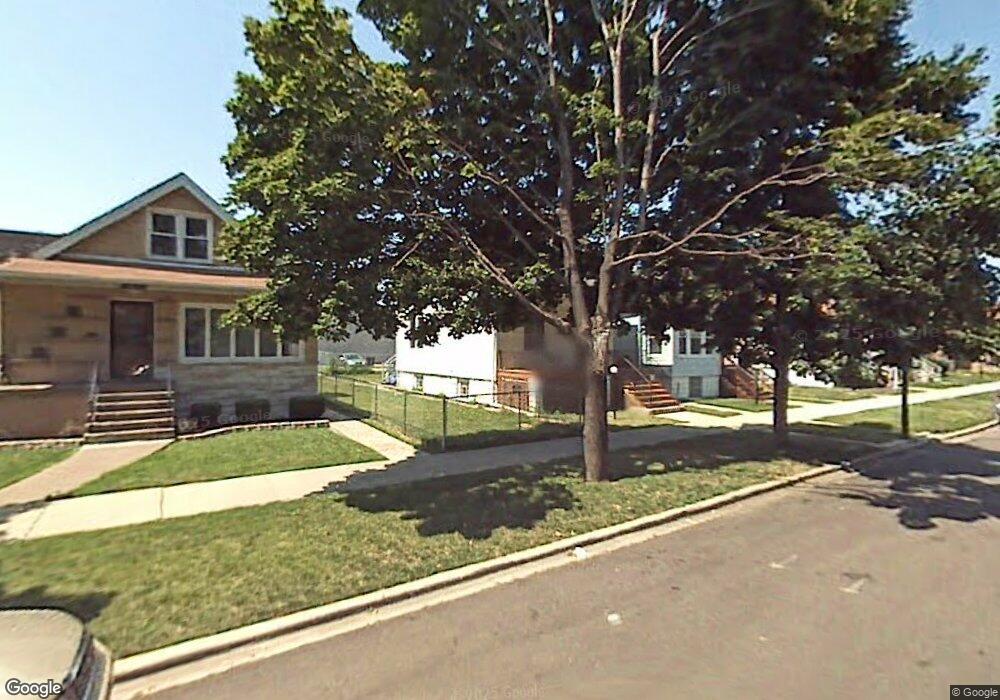
6450 S Claremont Ave Unit 52 Chicago, IL 60636
Englewood NeighborhoodEstimated Value: $145,529 - $170,000
3
Beds
1
Bath
672
Sq Ft
$236/Sq Ft
Est. Value
About This Home
This home is located at 6450 S Claremont Ave Unit 52, Chicago, IL 60636 and is currently estimated at $158,382, approximately $235 per square foot. 6450 S Claremont Ave Unit 52 is a home located in Cook County with nearby schools including Claremont Academy Elementary School, Marquette School of Excellence, and Gage Park High School.
Ownership History
Date
Name
Owned For
Owner Type
Purchase Details
Closed on
Sep 10, 2024
Sold by
Cook County Land Bank Authority and County Of Cook
Bought by
Gracia Group Llc
Current Estimated Value
Home Financials for this Owner
Home Financials are based on the most recent Mortgage that was taken out on this home.
Original Mortgage
$20,000
Interest Rate
6.09%
Mortgage Type
Seller Take Back
Purchase Details
Closed on
Nov 6, 2023
Sold by
Yarbrough Karen A
Bought by
Cook County Land Bk Authority
Purchase Details
Closed on
Feb 22, 2007
Sold by
Chicago Title Land Trust Co
Bought by
Jones Willie and Jones Zallie
Purchase Details
Closed on
Jun 8, 2006
Sold by
Jones Willie and Jones Farhley K
Bought by
Chicago Title Land Trust Co and Trust #8002346722
Purchase Details
Closed on
Oct 31, 2002
Sold by
Jones Willie
Bought by
Jones Farhley K and Jones Willie
Create a Home Valuation Report for This Property
The Home Valuation Report is an in-depth analysis detailing your home's value as well as a comparison with similar homes in the area
Home Values in the Area
Average Home Value in this Area
Purchase History
| Date | Buyer | Sale Price | Title Company |
|---|---|---|---|
| Gracia Group Llc | -- | Chicago Title | |
| Cook County Land Bk Authority | -- | None Listed On Document | |
| Jones Willie | -- | None Available | |
| Chicago Title Land Trust Co | -- | None Available | |
| Jones Farhley K | -- | -- |
Source: Public Records
Mortgage History
| Date | Status | Borrower | Loan Amount |
|---|---|---|---|
| Previous Owner | Gracia Group Llc | $20,000 |
Source: Public Records
Tax History Compared to Growth
Tax History
| Year | Tax Paid | Tax Assessment Tax Assessment Total Assessment is a certain percentage of the fair market value that is determined by local assessors to be the total taxable value of land and additions on the property. | Land | Improvement |
|---|---|---|---|---|
| 2024 | $1,167 | $6,801 | $938 | $5,863 |
| 2023 | $1,137 | $5,500 | $2,031 | $3,469 |
| 2022 | $1,137 | $5,500 | $2,031 | $3,469 |
| 2021 | $1,106 | $5,499 | $2,031 | $3,468 |
| 2020 | $1,282 | $5,718 | $2,031 | $3,687 |
| 2019 | $1,299 | $6,425 | $2,031 | $4,394 |
| 2018 | $1,277 | $6,425 | $2,031 | $4,394 |
| 2017 | $1,732 | $7,994 | $1,875 | $6,119 |
| 2016 | $1,612 | $7,994 | $1,875 | $6,119 |
| 2015 | $1,476 | $7,994 | $1,875 | $6,119 |
| 2014 | $1,254 | $6,706 | $1,718 | $4,988 |
| 2013 | $1,229 | $6,706 | $1,718 | $4,988 |
Source: Public Records
Map
Nearby Homes
- 6448 S Oakley Ave
- 6347 S Western Ave
- 6541 S Artesian Ave
- 6441 S Campbell Ave
- 6608 S Bell Ave
- 6622 S Artesian Ave
- 6545 S Hamilton Ave
- 6715 S Claremont Ave
- 6212 S Claremont Ave
- 6716 S Bell Ave
- 6423 S Hoyne Ave
- 6629 S Hamilton Ave
- 6221 S Campbell Ave
- 6527 S Talman Ave
- 6430 S Seeley Ave
- 6749 S Oakley Ave
- 6741 S Maplewood Ave
- 6543 S Washtenaw Ave
- 6734 S Maplewood Ave
- 6341 S Washtenaw Ave
- 6452 S Claremont Ave
- 6448 S Claremont Ave
- 6454 S Claremont Ave
- 6442 S Claremont Ave
- 6440 S Claremont Ave
- 6436 S Claremont Ave
- 6436 S Claremont Ave Unit 2
- 6500 S Claremont Ave
- 6500 S Claremont Ave
- 6432 S Claremont Ave
- 6453 S Claremont Ave
- 6502 S Claremont Ave
- 6449 S Claremont Ave
- 6449 S Claremont Ave
- 6455 S Claremont Ave
- 6447 S Claremont Ave
- 6430 S Claremont Ave
- 6459 S Claremont Ave
- 6445 S Claremont Ave
- 6443 S Claremont Ave