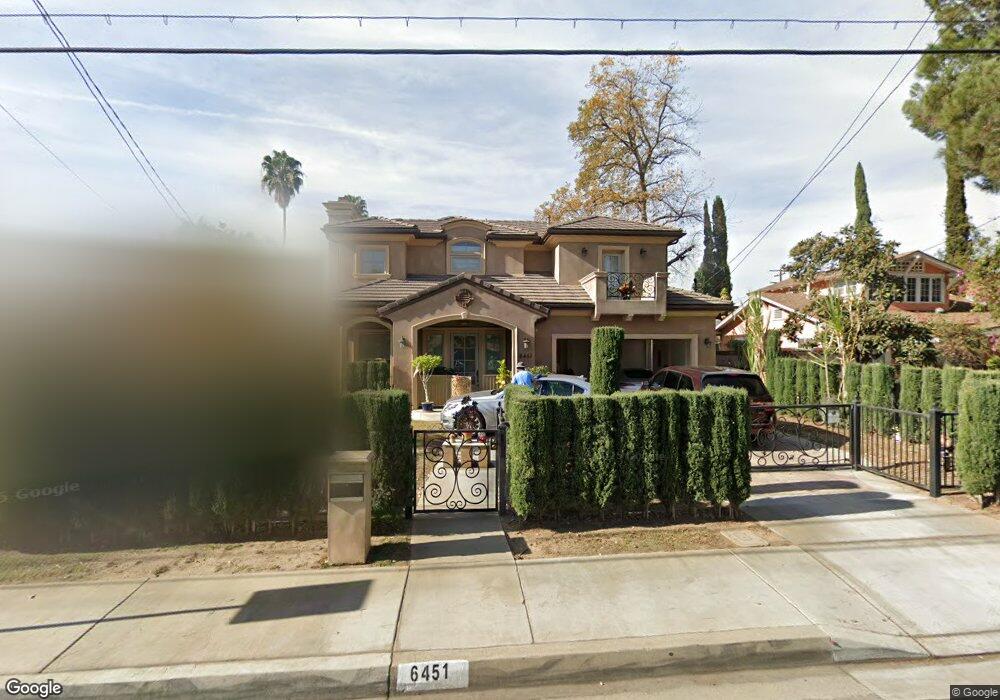
6451 Golden West Ave Temple City, CA 91780
Estimated Value: $1,598,942 - $1,790,000
4
Beds
3
Baths
2,444
Sq Ft
$684/Sq Ft
Est. Value
About This Home
This home is located at 6451 Golden West Ave, Temple City, CA 91780 and is currently estimated at $1,671,486, approximately $683 per square foot. 6451 Golden West Ave is a home located in Los Angeles County with nearby schools including Longden Elementary School, Oak Avenue Intermediate School, and Temple City High School.
Ownership History
Date
Name
Owned For
Owner Type
Purchase Details
Closed on
Apr 20, 2011
Sold by
Gw Temple Llc
Bought by
Chiu Patrick M and Chiu Li Huan
Current Estimated Value
Purchase Details
Closed on
Oct 25, 2010
Sold by
Kwok Grace Siu Hing
Bought by
Gw Temple Llc
Purchase Details
Closed on
Apr 28, 2009
Sold by
Tenlan Llc
Bought by
Kwok Grace Siu Hing
Purchase Details
Closed on
Dec 16, 2008
Sold by
Poyle James M
Bought by
Tenlan Llc
Purchase Details
Closed on
Aug 13, 2008
Sold by
Russell Jeffrey S
Bought by
Poyle James M and James M Poyle Revocable Living Trust
Purchase Details
Closed on
Jan 2, 2001
Sold by
Albert Susan
Bought by
Russell Jeffrey S and Russell Susan L
Home Financials for this Owner
Home Financials are based on the most recent Mortgage that was taken out on this home.
Original Mortgage
$162,000
Interest Rate
9.75%
Create a Home Valuation Report for This Property
The Home Valuation Report is an in-depth analysis detailing your home's value as well as a comparison with similar homes in the area
Home Values in the Area
Average Home Value in this Area
Purchase History
| Date | Buyer | Sale Price | Title Company |
|---|---|---|---|
| Chiu Patrick M | $890,000 | Fidelity National Title Co | |
| Gw Temple Llc | -- | None Available | |
| Kwok Grace Siu Hing | -- | None Available | |
| Tenlan Llc | $399,000 | Fidelity National Title Co | |
| Poyle James M | $66,000 | None Available | |
| Russell Jeffrey S | -- | Southland Title |
Source: Public Records
Mortgage History
| Date | Status | Borrower | Loan Amount |
|---|---|---|---|
| Previous Owner | Russell Jeffrey S | $162,000 |
Source: Public Records
Tax History Compared to Growth
Tax History
| Year | Tax Paid | Tax Assessment Tax Assessment Total Assessment is a certain percentage of the fair market value that is determined by local assessors to be the total taxable value of land and additions on the property. | Land | Improvement |
|---|---|---|---|---|
| 2025 | $13,188 | $1,140,234 | $800,730 | $339,504 |
| 2024 | $13,188 | $1,117,878 | $785,030 | $332,848 |
| 2023 | $12,886 | $1,095,960 | $769,638 | $326,322 |
| 2022 | $12,042 | $1,074,472 | $754,548 | $319,924 |
| 2021 | $12,272 | $1,053,404 | $739,753 | $313,651 |
| 2019 | $11,823 | $1,022,161 | $717,812 | $304,349 |
| 2018 | $11,583 | $1,002,120 | $703,738 | $298,382 |
| 2016 | $11,096 | $963,209 | $676,412 | $286,797 |
| 2015 | $10,907 | $948,742 | $666,252 | $282,490 |
| 2014 | $10,737 | $930,159 | $653,202 | $276,957 |
Source: Public Records
Map
Nearby Homes
- 9711 Woolley St
- 9861 E Lemon Ave
- 6326 Golden Ave W
- 9665 Longden Ave
- 9618 E Camino Real Ave
- 1522 S Baldwin Ave Unit 15
- 639 W Longden Ave
- 6159 Camellia Ave
- 9711 Garibaldi Ave
- 631 W Camino Real Ave
- 6119 Temple City Blvd
- 1004 W Duarte Rd Unit 6
- 1222 Temple City Blvd
- 1214 Temple City Blvd Unit 8
- 1228 Temple City Blvd
- 905 W Duarte Rd Unit A
- 9138 Emperor Ave
- 1430 Lovell Ave
- 2015 Bella Vista Ave
- 833 W Duarte Rd
- 6455 Golden West Ave
- 6443 Golden West Ave
- 9750 E Lemon Ave
- 6439 Golden West Ave
- 9738 E Lemon Ave
- 6448 Golden West Ave
- 6448 Golden Ave W
- 6454 Golden West Ave
- 6435 Golden West Ave
- 6454 Golden Ave W
- 6437 Golden West Ave
- 6435 Golden Ave W
- 6454 N Golden West Ave
- 9744 E Lemon Ave
- 6438 Golden West Ave
- 6454 Golden Ave W
- 9741 Woolley St
- 9757 E Lemon Ave
- 9759 E Lemon Ave
- 9736 E Lemon Ave