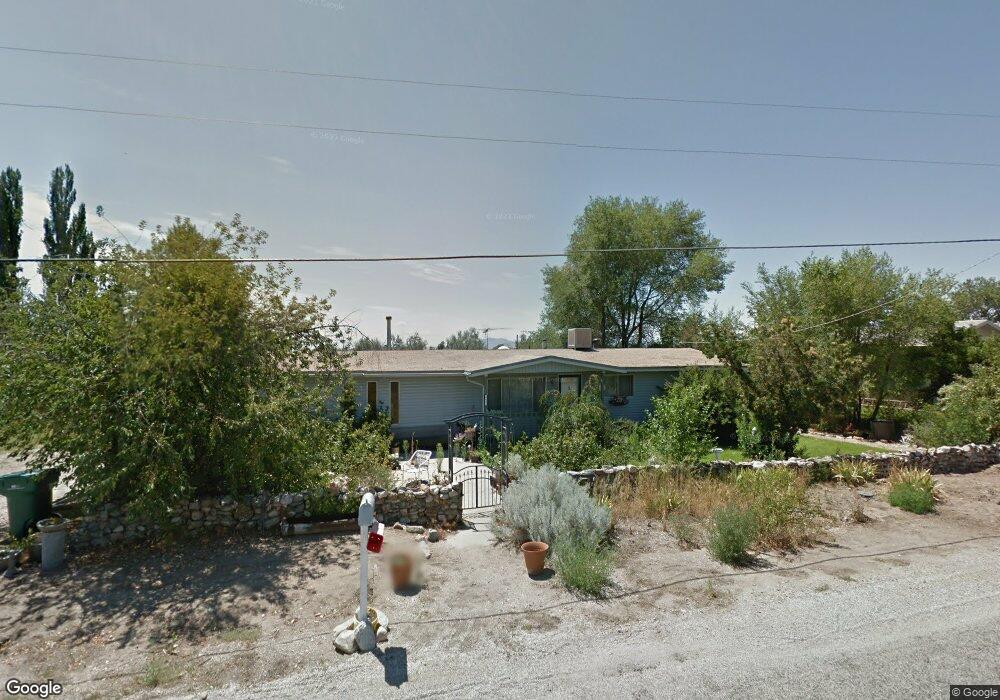
6451 W 5100 S Hooper, UT 84315
Estimated Value: $539,000 - $681,000
3
Beds
2
Baths
1,672
Sq Ft
$356/Sq Ft
Est. Value
About This Home
This home is located at 6451 W 5100 S, Hooper, UT 84315 and is currently estimated at $595,235, approximately $356 per square foot. 6451 W 5100 S is a home located in Weber County with nearby schools including Hooper Elementary School, Rocky Mountain Junior High School, and Fremont High School.
Ownership History
Date
Name
Owned For
Owner Type
Purchase Details
Closed on
Oct 10, 2024
Sold by
Weston Adam
Bought by
Weston Adam and Weston Melanie
Current Estimated Value
Home Financials for this Owner
Home Financials are based on the most recent Mortgage that was taken out on this home.
Original Mortgage
$484,500
Outstanding Balance
$479,407
Interest Rate
6.35%
Mortgage Type
New Conventional
Estimated Equity
$115,828
Purchase Details
Closed on
Oct 5, 2023
Sold by
Weston Adam
Bought by
Weston Adam and Weston Melanie
Home Financials for this Owner
Home Financials are based on the most recent Mortgage that was taken out on this home.
Original Mortgage
$479,750
Interest Rate
7.23%
Mortgage Type
New Conventional
Purchase Details
Closed on
Oct 3, 2023
Sold by
Harrison Austin M and Harrison Lauren A
Bought by
Weston Adam
Home Financials for this Owner
Home Financials are based on the most recent Mortgage that was taken out on this home.
Original Mortgage
$479,750
Interest Rate
7.23%
Mortgage Type
New Conventional
Purchase Details
Closed on
Nov 21, 2019
Sold by
Kimball Glennyn R and Demas Jamie
Bought by
Harrison Austin M and Harrison Lauren A
Home Financials for this Owner
Home Financials are based on the most recent Mortgage that was taken out on this home.
Original Mortgage
$343,734
Interest Rate
3.5%
Mortgage Type
VA
Purchase Details
Closed on
Oct 5, 2018
Sold by
Mcfarland Thomas L and Mcfarland Kaycee
Bought by
Kimball Glennyn R and Demas Jamie
Home Financials for this Owner
Home Financials are based on the most recent Mortgage that was taken out on this home.
Original Mortgage
$280,155
Interest Rate
4.5%
Mortgage Type
New Conventional
Purchase Details
Closed on
Feb 10, 2014
Sold by
Dayes Halverson Beryl
Bought by
Mcfarland Thomas L and Mcfarland Kaycee
Home Financials for this Owner
Home Financials are based on the most recent Mortgage that was taken out on this home.
Original Mortgage
$144,400
Interest Rate
4.49%
Mortgage Type
New Conventional
Create a Home Valuation Report for This Property
The Home Valuation Report is an in-depth analysis detailing your home's value as well as a comparison with similar homes in the area
Home Values in the Area
Average Home Value in this Area
Purchase History
| Date | Buyer | Sale Price | Title Company |
|---|---|---|---|
| Weston Adam | -- | Advanced Title | |
| Weston Adam | -- | Advanced Title | |
| Weston Adam | -- | Advanced Title | |
| Weston Adam | -- | Metro National Title | |
| Harrison Austin M | -- | Us Title Insurance Agency | |
| Kimball Glennyn R | -- | Mountain View Ttl Ogden Elec | |
| Mcfarland Thomas L | -- | Backman Title Services Ltd |
Source: Public Records
Mortgage History
| Date | Status | Borrower | Loan Amount |
|---|---|---|---|
| Open | Weston Adam | $484,500 | |
| Previous Owner | Weston Adam | $479,750 | |
| Previous Owner | Harrison Austin M | $343,734 | |
| Previous Owner | Kimball Glennyn R | $280,155 | |
| Previous Owner | Mcfarland Thomas L | $144,400 |
Source: Public Records
Tax History Compared to Growth
Tax History
| Year | Tax Paid | Tax Assessment Tax Assessment Total Assessment is a certain percentage of the fair market value that is determined by local assessors to be the total taxable value of land and additions on the property. | Land | Improvement |
|---|---|---|---|---|
| 2025 | $2,975 | $518,871 | $179,965 | $338,906 |
| 2024 | $2,866 | $279,949 | $98,980 | $180,969 |
| 2023 | $2,909 | $281,600 | $99,002 | $182,598 |
| 2022 | $2,739 | $271,150 | $82,501 | $188,649 |
| 2021 | $2,068 | $345,000 | $115,000 | $230,000 |
| 2020 | $1,819 | $278,000 | $80,000 | $198,000 |
| 2019 | $1,730 | $250,000 | $60,064 | $189,936 |
| 2018 | $1,548 | $214,000 | $55,037 | $158,963 |
| 2017 | $1,427 | $191,000 | $55,031 | $135,969 |
| 2016 | $1,422 | $102,797 | $28,600 | $74,197 |
| 2015 | $1,340 | $95,462 | $24,798 | $70,664 |
| 2014 | $1,331 | $92,236 | $30,250 | $61,986 |
Source: Public Records
Map
Nearby Homes
- 6360 W 5500 S
- 6014 W 5300 S
- 6036 W 4700 S
- 0 W 5500 S
- 5319 S 7100 W
- 3729 S 5600 W Unit 6
- 3720 S 5600 W Unit 2
- 3719 S 5600 W Unit 7
- 5801 S 7100 W
- 4146 S 5800 W Unit 5
- 4163 S 5800 W Unit 2
- 5752 W 2425 N
- 5335 W 5500 S
- 4100 S 5900 W
- 3632 S 5400 W
- 4879 S 5050 W
- 4111 S 5350 W
- 3191 S 5100 St W Unit 1
- 3706 S 5650 W Unit 9
- 3691 S 5600 W Unit 20