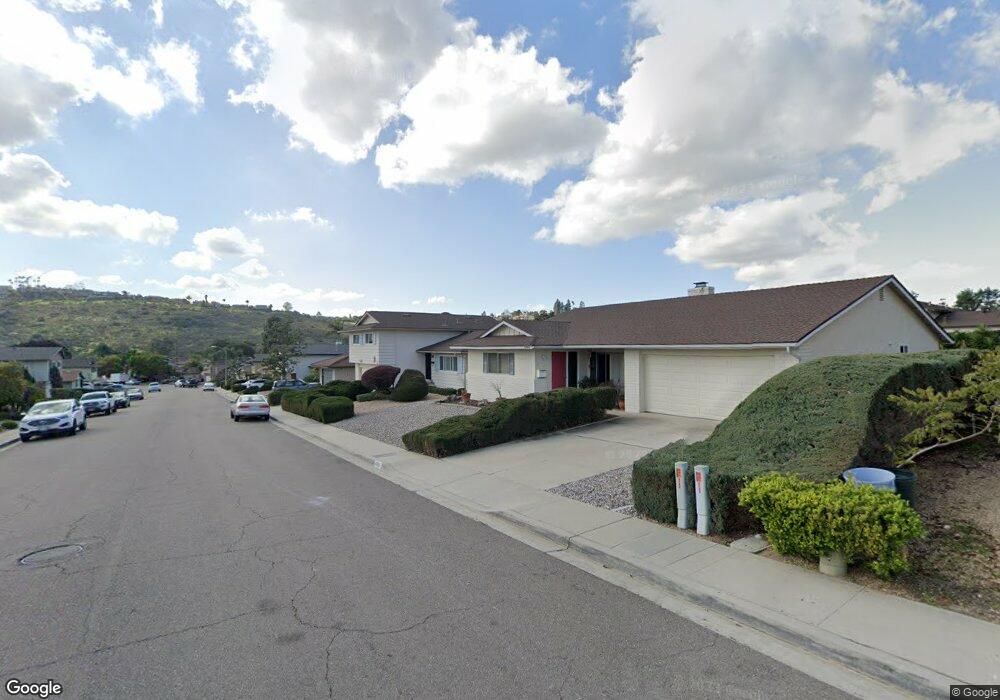
6456 Bonnie View Dr San Diego, CA 92119
San Carlos NeighborhoodEstimated Value: $1,078,155 - $1,286,000
4
Beds
3
Baths
1,698
Sq Ft
$687/Sq Ft
Est. Value
About This Home
This home is located at 6456 Bonnie View Dr, San Diego, CA 92119 and is currently estimated at $1,166,539, approximately $687 per square foot. 6456 Bonnie View Dr is a home located in San Diego County with nearby schools including Green Elementary School, Pershing Middle School, and Patrick Henry High School.
Ownership History
Date
Name
Owned For
Owner Type
Purchase Details
Closed on
Nov 15, 2010
Sold by
Dierker James Timothy and Garrett Sheryll K
Bought by
Dierker James Timothy
Current Estimated Value
Home Financials for this Owner
Home Financials are based on the most recent Mortgage that was taken out on this home.
Original Mortgage
$205,000
Outstanding Balance
$2,938
Interest Rate
3.6%
Mortgage Type
New Conventional
Estimated Equity
$1,163,601
Purchase Details
Closed on
Jul 14, 2005
Sold by
Garrett Sheryll K
Bought by
Garrett Sheryll K
Purchase Details
Closed on
Apr 14, 2004
Sold by
Dierker James T
Bought by
Dierker James Timothy and James Timothy Dierker Living Trust
Purchase Details
Closed on
Nov 3, 1998
Sold by
Dierker James T and Dierker Sheryll G
Bought by
Dierker James T and Garrett Sheryll G
Home Financials for this Owner
Home Financials are based on the most recent Mortgage that was taken out on this home.
Original Mortgage
$177,200
Interest Rate
6.42%
Purchase Details
Closed on
May 29, 1984
Create a Home Valuation Report for This Property
The Home Valuation Report is an in-depth analysis detailing your home's value as well as a comparison with similar homes in the area
Home Values in the Area
Average Home Value in this Area
Purchase History
| Date | Buyer | Sale Price | Title Company |
|---|---|---|---|
| Dierker James Timothy | -- | Stewart Title Of California | |
| Dierker James Timothy | -- | Stewart Title Of California | |
| Garrett Sheryll K | -- | -- | |
| Dierker James Timothy | -- | -- | |
| Dierker James T | -- | Commonwealth Land Title Co | |
| -- | $143,000 | -- |
Source: Public Records
Mortgage History
| Date | Status | Borrower | Loan Amount |
|---|---|---|---|
| Open | Dierker James Timothy | $205,000 | |
| Closed | Dierker James T | $177,200 |
Source: Public Records
Tax History Compared to Growth
Tax History
| Year | Tax Paid | Tax Assessment Tax Assessment Total Assessment is a certain percentage of the fair market value that is determined by local assessors to be the total taxable value of land and additions on the property. | Land | Improvement |
|---|---|---|---|---|
| 2025 | $3,574 | $296,234 | $61,121 | $235,113 |
| 2024 | $3,574 | $290,426 | $59,923 | $230,503 |
| 2023 | $3,504 | $284,733 | $58,749 | $225,984 |
| 2022 | $3,410 | $279,151 | $57,598 | $221,553 |
| 2021 | $3,384 | $273,678 | $56,469 | $217,209 |
| 2020 | $3,344 | $270,872 | $55,890 | $214,982 |
| 2019 | $3,283 | $265,562 | $54,795 | $210,767 |
| 2018 | $3,068 | $260,356 | $53,721 | $206,635 |
| 2017 | $2,994 | $255,252 | $52,668 | $202,584 |
| 2016 | $2,943 | $250,248 | $51,636 | $198,612 |
| 2015 | $2,899 | $246,490 | $50,861 | $195,629 |
| 2014 | $2,844 | $241,662 | $49,865 | $191,797 |
Source: Public Records
Map
Nearby Homes
- 6812 Hyde Park Dr Unit G
- 6812 Hyde Park Dr Unit C
- 6924 Hyde Park Dr Unit 115
- 6960 Hyde Park Dr Unit 8
- 6960 Hyde Park Dr Unit 4
- 6737 Oakridge Rd Unit 205
- 6755 Caminito Del Greco
- 6221 Brynwood Ct
- 6815 Caminito Mundo Unit 23
- 7328 Caminito Carlotta
- 6878 Navajo Rd Unit 70
- 7360 Park Ridge Blvd Unit 119
- 6877 Caminito Mundo Unit 25
- 7056 Del Cerro Blvd
- 5873 Madra Ave
- 6163 Baltimore Dr
- 7426 Caminito Carlotta
- 6303 Caminito Tenedor
- 6243 Lake Lomond Dr
- 6347 Elmhurst Dr
- 6446 Bonnie View Dr
- 6466 Bonnie View Dr
- 6453 Casselberry Way
- 6461 Casselberry Way
- 6434 Bonnie View Dr
- 6445 Casselberry Way Unit 7
- 6478 Bonnie View Dr
- 6475 Casselberry Way
- 6453 Bonnie View Dr
- 6465 Bonnie View Dr
- 6435 Casselberry Way
- 6441 Bonnie View Dr
- 6426 Bonnie View Dr
- 6486 Bonnie View Dr
- 6477 Bonnie View Dr
- 6483 Casselberry Way
- 6419 Bonnie View Dr
- 6423 Casselberry Way
- 6485 Bonnie View Dr
- 6498 Bonnie View Dr