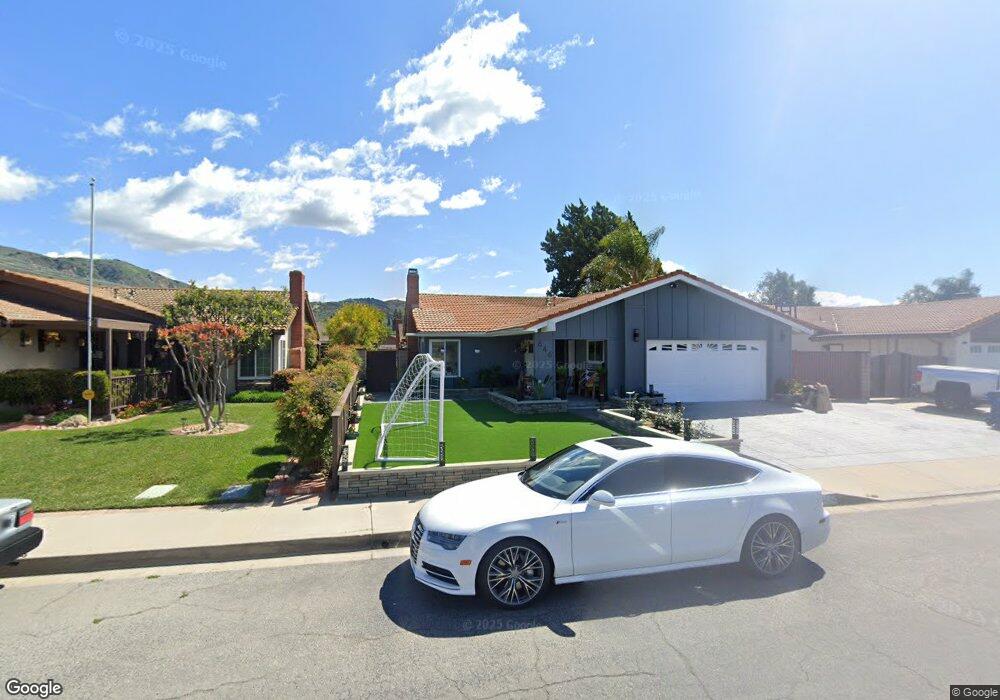
646 Chaparral St Fillmore, CA 93015
Estimated Value: $616,000 - $721,469
3
Beds
2
Baths
1,387
Sq Ft
$487/Sq Ft
Est. Value
About This Home
This home is located at 646 Chaparral St, Fillmore, CA 93015 and is currently estimated at $676,117, approximately $487 per square foot. 646 Chaparral St is a home located in Ventura County with nearby schools including Fillmore Senior High.
Ownership History
Date
Name
Owned For
Owner Type
Purchase Details
Closed on
Dec 20, 2021
Sold by
Rodriguez Valdivia Antonio
Bought by
Valdivia Mercedes Magana
Current Estimated Value
Home Financials for this Owner
Home Financials are based on the most recent Mortgage that was taken out on this home.
Original Mortgage
$522,000
Outstanding Balance
$480,103
Interest Rate
3.11%
Mortgage Type
New Conventional
Estimated Equity
$196,014
Purchase Details
Closed on
Dec 10, 2021
Sold by
Maria D Acosta Trust and The Maria D Acosta Trust
Bought by
Valdivia Minerva and Valdivia Mercedes Magana
Home Financials for this Owner
Home Financials are based on the most recent Mortgage that was taken out on this home.
Original Mortgage
$522,000
Outstanding Balance
$480,103
Interest Rate
3.11%
Mortgage Type
New Conventional
Estimated Equity
$196,014
Create a Home Valuation Report for This Property
The Home Valuation Report is an in-depth analysis detailing your home's value as well as a comparison with similar homes in the area
Home Values in the Area
Average Home Value in this Area
Purchase History
| Date | Buyer | Sale Price | Title Company |
|---|---|---|---|
| Valdivia Mercedes Magana | -- | Consumers Title | |
| Valdivia Minerva | $580,000 | Consumers Title |
Source: Public Records
Mortgage History
| Date | Status | Borrower | Loan Amount |
|---|---|---|---|
| Open | Valdivia Mercedes Magana | $522,000 | |
| Closed | Valdivia Minerva | $522,000 |
Source: Public Records
Tax History
| Year | Tax Paid | Tax Assessment Tax Assessment Total Assessment is a certain percentage of the fair market value that is determined by local assessors to be the total taxable value of land and additions on the property. | Land | Improvement |
|---|---|---|---|---|
| 2025 | $6,794 | $615,500 | $400,075 | $215,425 |
| 2024 | $6,794 | $603,432 | $392,231 | $211,201 |
| 2023 | $6,700 | $591,600 | $384,540 | $207,060 |
| 2022 | $6,193 | $580,000 | $377,000 | $203,000 |
| 2021 | $1,610 | $133,123 | $14,903 | $118,220 |
| 2020 | $1,495 | $131,759 | $14,751 | $117,008 |
| 2019 | $1,498 | $129,176 | $14,462 | $114,714 |
| 2018 | $1,467 | $126,644 | $14,179 | $112,465 |
| 2017 | $1,474 | $124,161 | $13,901 | $110,260 |
| 2016 | $1,366 | $121,728 | $13,629 | $108,099 |
| 2015 | $1,326 | $119,901 | $13,425 | $106,476 |
| 2014 | $1,325 | $117,555 | $13,163 | $104,392 |
Source: Public Records
Map
Nearby Homes
- 831 Blaine Ave
- 949 Blaine Ave
- 815 Woodgrove Rd
- 809 Woodgrove Rd
- 600 C St
- 1106 Mockingbird Ln
- 313 C St
- 404 Central Ave
- 345 Blaine Ave
- 340 Central Ave
- 1262 Sespe Ave
- 639 Mountain View St
- 318 Bard St
- 320 D St
- 1163 W Ventura St
- 616 Island View St
- 578 Apricot Ln
- 228 Parkhaven Ct
- 549 Heritage Valley Pkwy
- 513 Heritage Valley Pkwy
- 646 Chapparel St
- 652 Chapparel St
- 638 Chaparral St
- 638 Chapparel St
- 660 Chapparel St
- 647 Manzanita Dr
- 653 Manzanita Dr
- 639 Manzanita Dr
- 634 Chapparel St
- 826 3rd St
- 651 Chapparel St
- 659 Manzanita Dr
- 643 Chapparel St
- 635 Manzanita Dr
- 639 Chapparel St
- 834 3rd St
- 628 Chapparel St
- 629 Manzanita Dr
- 631 Chapparel St
- 764 3rd St
Your Personal Tour Guide
Ask me questions while you tour the home.