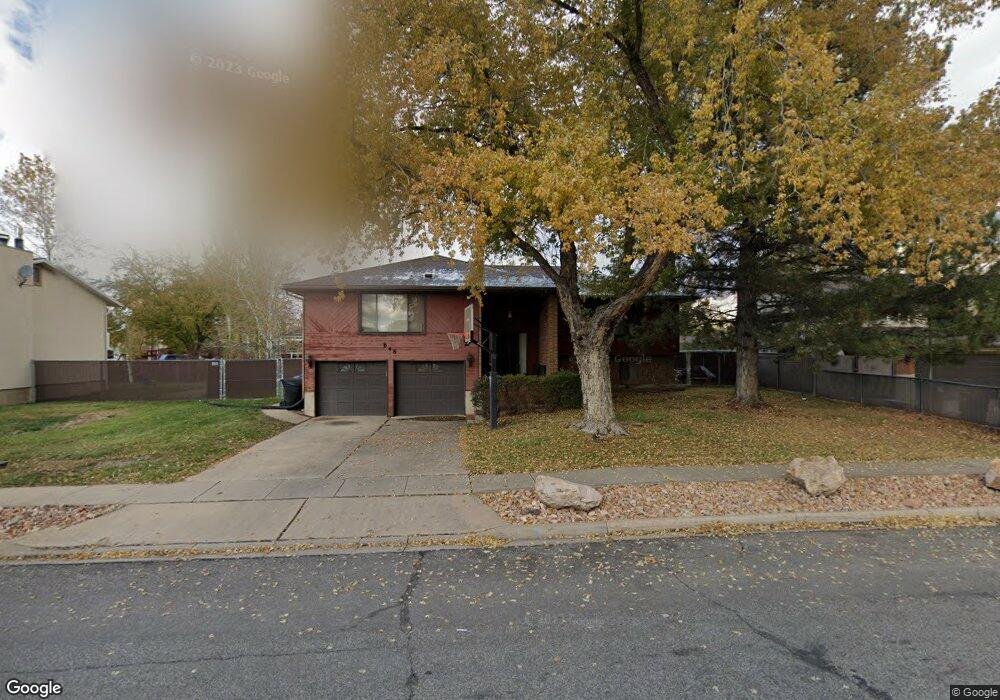
646 Creek View Rd Centerville, UT 84014
Estimated Value: $547,000 - $585,113
3
Beds
3
Baths
2,869
Sq Ft
$199/Sq Ft
Est. Value
About This Home
This home is located at 646 Creek View Rd, Centerville, UT 84014 and is currently estimated at $571,778, approximately $199 per square foot. 646 Creek View Rd is a home located in Davis County with nearby schools including Stewart Elementary School, Centerville Jr High, and Viewmont High School.
Ownership History
Date
Name
Owned For
Owner Type
Purchase Details
Closed on
Dec 20, 2023
Sold by
Nish Michael Dean
Bought by
Nish Andrew
Current Estimated Value
Purchase Details
Closed on
Feb 18, 2009
Sold by
Nish Laurie C
Bought by
Nish Michael D
Home Financials for this Owner
Home Financials are based on the most recent Mortgage that was taken out on this home.
Original Mortgage
$132,250
Interest Rate
4.55%
Mortgage Type
New Conventional
Purchase Details
Closed on
Jun 28, 2001
Sold by
Anderson Marilyn
Bought by
Nish Michael D and Nish Laurie C
Home Financials for this Owner
Home Financials are based on the most recent Mortgage that was taken out on this home.
Original Mortgage
$119,900
Interest Rate
7.14%
Purchase Details
Closed on
Aug 14, 1997
Sold by
Hughes Glen L and Hughes Joanne M
Bought by
Anderson Marilyn
Create a Home Valuation Report for This Property
The Home Valuation Report is an in-depth analysis detailing your home's value as well as a comparison with similar homes in the area
Purchase History
We collect this data history from publicly available records. To have your information removed, we recommend requesting removal directly through your county’s website.
| Date | Buyer | Sale Price | Title Company |
|---|---|---|---|
| Nish Andrew | -- | Sutherland Title | |
| Nish Michael D | -- | Metro National Title | |
| Nish Michael D | -- | First American Title Insuran | |
| Anderson Marilyn | -- | Associated Title Company |
Source: Public Records
Mortgage History
We collect this data history from publicly available records. To have your information removed, we recommend requesting removal directly through your county’s website.
| Date | Status | Borrower | Loan Amount |
|---|---|---|---|
| Previous Owner | Nish Michael D | $132,250 | |
| Previous Owner | Nish Michael D | $119,900 |
Source: Public Records
Tax History
| Year | Tax Paid | Tax Assessment Tax Assessment Total Assessment is a certain percentage of the fair market value that is determined by local assessors to be the total taxable value of land and additions on the property. | Land | Improvement |
|---|---|---|---|---|
| 2025 | $3,007 | $287,650 | $162,074 | $125,576 |
| 2024 | $2,996 | $291,500 | $145,372 | $146,128 |
| 2023 | $2,873 | $505,000 | $238,855 | $266,145 |
| 2022 | $3,028 | $293,150 | $120,528 | $172,622 |
| 2021 | $2,686 | $405,000 | $183,448 | $221,552 |
| 2020 | $2,295 | $346,000 | $179,462 | $166,538 |
| 2019 | $2,323 | $342,000 | $180,864 | $161,136 |
| 2018 | $2,152 | $313,000 | $167,879 | $145,121 |
| 2016 | $1,875 | $151,580 | $53,569 | $98,011 |
| 2015 | $1,806 | $137,720 | $53,569 | $84,151 |
| 2014 | $1,633 | $127,414 | $53,569 | $73,845 |
| 2013 | -- | $116,328 | $42,323 | $74,005 |
Source: Public Records
Map
Nearby Homes
- 523 Mountain View Rd
- 527 W 620 N Unit 133
- 507 W 620 N
- 914 N 400 W
- 281 W 650 N Unit B
- 282 W 605 N Unit A
- 282 W 605 N Unit I
- 271 Brookfield Ln
- 165 W Pheasantbrook Dr
- 1166 N 700 W
- 1171 N 725 W
- 371 W 1125 N
- 732 W 1175 N
- 257 W 1125 N
- 66 Brookside Ln
- 610 N Main St
- 147 N 360 W Unit 21
- 1333 W 1275 N Unit 3
- 1357 W 1275 N Unit 4
- 871 Bonita Way
- 652 Creek View Rd
- 644 Creek View Rd
- 647 Mountain View Rd
- 649 Mountain View Rd
- 645 Mountain View Rd
- 649 Creek View Rd
- 674 Creek View Rd
- 638 Creek View Rd
- 643 Creek View Rd
- 665 Mountain View Rd
- 667 Creek View Rd
- 711 Applewood Dr
- 641 Creek View Rd
- 634 Creek View Rd
- 710 Creek View Rd
- 642 Mountain View Rd
- 642 Applewood Dr
- 778 Mountain View Rd
- 710 Creek View Rd
- 602 Applewood Dr
Your Personal Tour Guide
Ask me questions while you tour the home.