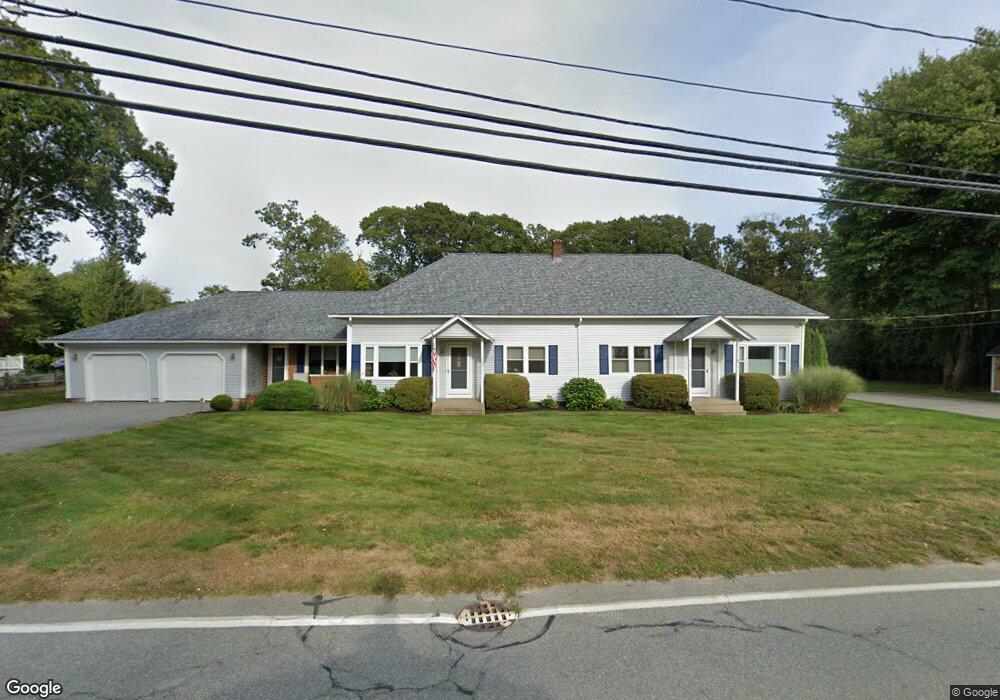
646 Main Rd Unit 648 Westport, MA 02790
Booth/Handy Four Corners NeighborhoodEstimated Value: $464,000 - $704,000
4
Beds
3
Baths
2,362
Sq Ft
$268/Sq Ft
Est. Value
About This Home
This home is located at 646 Main Rd Unit 648, Westport, MA 02790 and is currently estimated at $632,671, approximately $267 per square foot. 646 Main Rd Unit 648 is a home located in Bristol County with nearby schools including Alice A. Macomber Primary School, Westport Elementary School, and Westport Middle-High School.
Ownership History
Date
Name
Owned For
Owner Type
Purchase Details
Closed on
Apr 9, 2021
Sold by
Rice James R Est and Obrien
Bought by
Haddie Rt and Sabra
Current Estimated Value
Purchase Details
Closed on
Apr 15, 2015
Sold by
Vaughan Mark C
Bought by
Rice James R
Purchase Details
Closed on
Aug 23, 2004
Sold by
Rvt Rt and Trecida
Bought by
Rice James R and Vaughan Mark C
Home Financials for this Owner
Home Financials are based on the most recent Mortgage that was taken out on this home.
Original Mortgage
$374,250
Interest Rate
6.03%
Mortgage Type
Purchase Money Mortgage
Create a Home Valuation Report for This Property
The Home Valuation Report is an in-depth analysis detailing your home's value as well as a comparison with similar homes in the area
Home Values in the Area
Average Home Value in this Area
Purchase History
| Date | Buyer | Sale Price | Title Company |
|---|---|---|---|
| Haddie Rt | $400,000 | None Available | |
| Haddie Rt | $400,000 | None Available | |
| Rice James R | -- | -- | |
| Rice James R | -- | -- | |
| Rice James R | $499,000 | -- | |
| Rice James R | $499,000 | -- |
Source: Public Records
Mortgage History
| Date | Status | Borrower | Loan Amount |
|---|---|---|---|
| Previous Owner | Rice James R | $373,000 | |
| Previous Owner | Rice James R | $374,250 | |
| Previous Owner | Rice James R | $40,000 |
Source: Public Records
Tax History Compared to Growth
Tax History
| Year | Tax Paid | Tax Assessment Tax Assessment Total Assessment is a certain percentage of the fair market value that is determined by local assessors to be the total taxable value of land and additions on the property. | Land | Improvement |
|---|---|---|---|---|
| 2025 | $4,417 | $592,900 | $173,300 | $419,600 |
| 2024 | $4,405 | $569,900 | $153,600 | $416,300 |
| 2023 | $4,273 | $523,700 | $132,900 | $390,800 |
| 2022 | $2,843 | $416,800 | $132,900 | $283,900 |
| 2021 | $2,843 | $329,800 | $114,800 | $215,000 |
| 2020 | $2,693 | $319,400 | $104,400 | $215,000 |
| 2019 | $2,675 | $323,400 | $104,400 | $219,000 |
| 2018 | $2,452 | $300,100 | $115,500 | $184,600 |
| 2017 | $2,327 | $292,000 | $111,800 | $180,200 |
| 2016 | $2,280 | $288,300 | $108,100 | $180,200 |
| 2015 | $2,086 | $263,000 | $110,500 | $152,500 |
Source: Public Records
Map
Nearby Homes
- 7 Village Way
- 15 Village Way
- 8 Village Way
- 8 Strawberry Ln
- 837 Main Rd
- 118 Charlotte White Rd Extension
- 0 Hidden Glen Ln
- 118 Charlotte White Rd
- 101 Adamsville Rd
- 920 Drift Rd
- 978 Sodom Rd
- 225 Hixbridge Rd
- Lot 0 Marcotte
- 47 Fallon Dr
- 73 White Oak Run
- 4 Main Rd
- 6 Angel Ct
- 1346 Main Rd Unit B
- 308 Robert St
- 17 Quail Trail