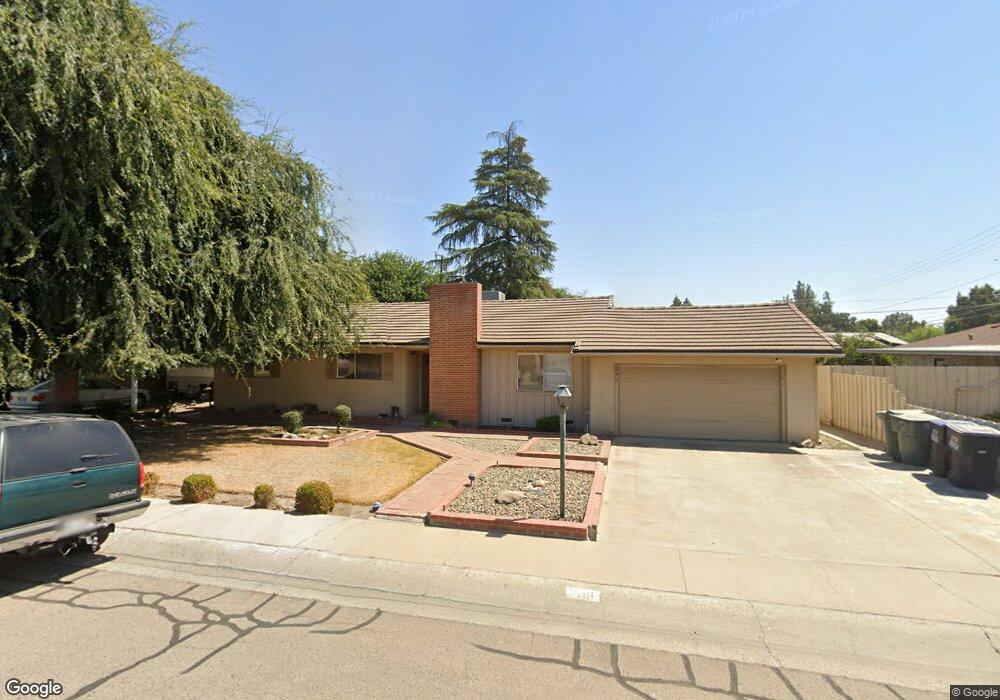
646 S Whitney Dr Visalia, CA 93277
Mooney NeighborhoodEstimated Value: $354,906 - $446,000
3
Beds
2
Baths
1,779
Sq Ft
$217/Sq Ft
Est. Value
About This Home
This home is located at 646 S Whitney Dr, Visalia, CA 93277 and is currently estimated at $385,477, approximately $216 per square foot. 646 S Whitney Dr is a home located in Tulare County with nearby schools including Royal Oaks Elementary School, Green Acres Middle School, and Mt. Whitney High School.
Ownership History
Date
Name
Owned For
Owner Type
Purchase Details
Closed on
Jun 5, 2008
Sold by
Federal Home Loan Mortgage Corporation
Bought by
Cesena Marcus R
Current Estimated Value
Home Financials for this Owner
Home Financials are based on the most recent Mortgage that was taken out on this home.
Original Mortgage
$143,840
Outstanding Balance
$92,302
Interest Rate
6.05%
Mortgage Type
Purchase Money Mortgage
Estimated Equity
$293,175
Purchase Details
Closed on
Apr 8, 2008
Sold by
Moeai Mark A
Bought by
Federal Home Loan Mortgage Corporation
Home Financials for this Owner
Home Financials are based on the most recent Mortgage that was taken out on this home.
Original Mortgage
$143,840
Outstanding Balance
$92,302
Interest Rate
6.05%
Mortgage Type
Purchase Money Mortgage
Estimated Equity
$293,175
Purchase Details
Closed on
Jan 3, 2003
Sold by
Moeai Ofa K
Bought by
Moeai Mark A
Home Financials for this Owner
Home Financials are based on the most recent Mortgage that was taken out on this home.
Original Mortgage
$139,650
Interest Rate
5.89%
Purchase Details
Closed on
May 20, 1994
Sold by
Bradbrook Lucinda Louise
Bought by
Braly Catherine O
Create a Home Valuation Report for This Property
The Home Valuation Report is an in-depth analysis detailing your home's value as well as a comparison with similar homes in the area
Home Values in the Area
Average Home Value in this Area
Purchase History
| Date | Buyer | Sale Price | Title Company |
|---|---|---|---|
| Cesena Marcus R | $160,000 | Chicago Title Insurance | |
| Federal Home Loan Mortgage Corporation | $144,656 | Accommodation | |
| Moeai Mark A | -- | Fidelity National Title Co | |
| Moeai Mark A | $147,000 | Fidelity National Title Co | |
| Braly Catherine O | -- | -- |
Source: Public Records
Mortgage History
| Date | Status | Borrower | Loan Amount |
|---|---|---|---|
| Open | Cesena Marcus R | $143,840 | |
| Previous Owner | Moeai Mark A | $139,650 |
Source: Public Records
Tax History Compared to Growth
Tax History
| Year | Tax Paid | Tax Assessment Tax Assessment Total Assessment is a certain percentage of the fair market value that is determined by local assessors to be the total taxable value of land and additions on the property. | Land | Improvement |
|---|---|---|---|---|
| 2025 | $2,218 | $210,161 | $65,672 | $144,489 |
| 2024 | $2,218 | $206,041 | $64,385 | $141,656 |
| 2023 | $2,157 | $202,002 | $63,123 | $138,879 |
| 2022 | $2,061 | $198,042 | $61,886 | $136,156 |
| 2021 | $2,064 | $194,159 | $60,673 | $133,486 |
| 2020 | $2,046 | $192,168 | $60,051 | $132,117 |
| 2019 | $1,988 | $188,400 | $58,874 | $129,526 |
| 2018 | $1,938 | $184,706 | $57,720 | $126,986 |
| 2017 | $1,918 | $181,084 | $56,588 | $124,496 |
| 2016 | $1,882 | $177,533 | $55,478 | $122,055 |
| 2015 | $1,828 | $174,867 | $54,645 | $120,222 |
| 2014 | $1,828 | $171,442 | $53,575 | $117,867 |
Source: Public Records
Map
Nearby Homes
- 1103 S Linda Vista St
- 1138 S Valley St
- 1127 S Whitney Dr
- 3124 W Tulare Ave
- 1330 S Clover St
- 3425 W Laurel Ave
- 3125 W Howard Ave
- 3515 W Iris Ave
- 1419 S Crowe St
- 3735 W Woodside Ave
- 0000 Hyde Park Lot 4
- 2921 W Cornell Ave
- 820 S Chinowth St Unit 93
- 820 S Chinowth St Unit 102
- 820 S Chinowth St
- 820 S Chinowth St Unit 74
- 820 S Chinowth St Unit 98
- 820 S Chinowth St Unit 70
- 820 S Chinowth St Unit 80
- 820 S Chinowth St Unit 72
- 634 S Whitney Dr
- 2910 W Campus Ave
- 617 S Linda Vista St
- 622 S Whitney Dr
- 621 S Linda Vista St
- 611 S Linda Vista St
- 645 S Whitney St
- 645 S Whitney Dr
- 2938 W Campus Ave
- 633 S Whitney Dr
- 2907 W Campus Ave
- 607 S Linda Vista St
- 610 S Whitney Dr
- 617 S Whitney Dr
- 601 S Linda Vista St
- 738 S Whitney Dr
- 2941 W Campus Ave
- 738 S Whitney Dr
- 548 S Whitney Dr
- 646 S Redwood Dr