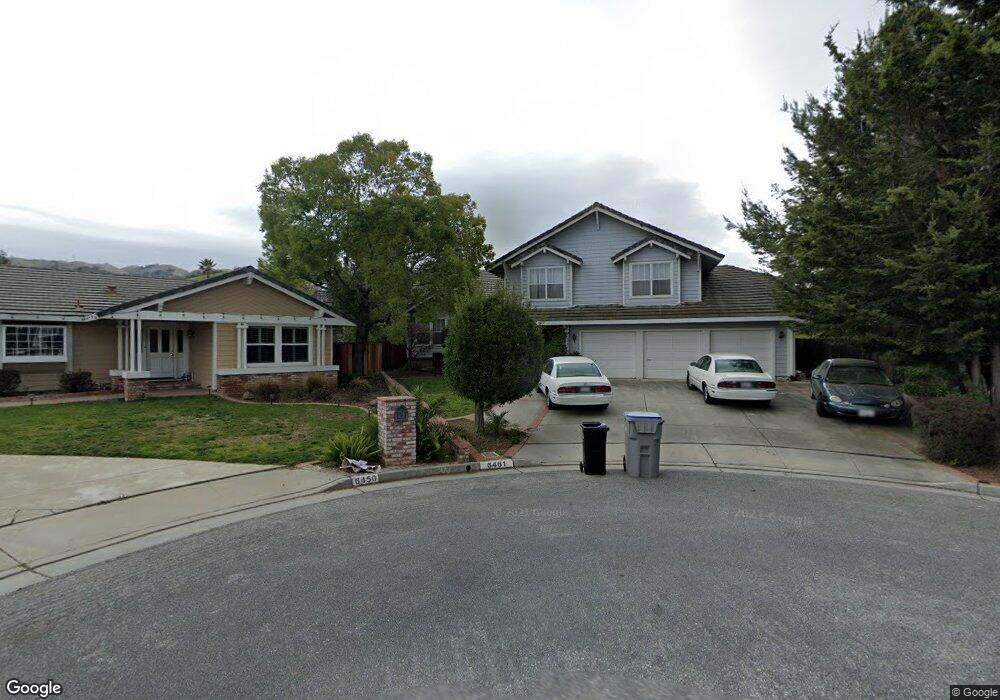
6461 Rolling Meadow Ct San Jose, CA 95135
The Meadowlands NeighborhoodEstimated Value: $1,051,000 - $3,209,000
5
Beds
3
Baths
3,066
Sq Ft
$795/Sq Ft
Est. Value
About This Home
This home is located at 6461 Rolling Meadow Ct, San Jose, CA 95135 and is currently estimated at $2,436,692, approximately $794 per square foot. 6461 Rolling Meadow Ct is a home located in Santa Clara County with nearby schools including Silver Oak Elementary School, Chaboya Middle School, and Silver Creek High School.
Ownership History
Date
Name
Owned For
Owner Type
Purchase Details
Closed on
Aug 17, 2011
Sold by
Patel Renuka
Bought by
Patel Renuka
Current Estimated Value
Home Financials for this Owner
Home Financials are based on the most recent Mortgage that was taken out on this home.
Original Mortgage
$224,200
Outstanding Balance
$152,972
Interest Rate
4.26%
Mortgage Type
New Conventional
Estimated Equity
$2,283,720
Purchase Details
Closed on
Feb 7, 2005
Sold by
Patel Renuka
Bought by
Patel Arpit Alex and Patel Renuka
Purchase Details
Closed on
Aug 6, 2004
Sold by
Patel Ramesh K and Patel Girish K
Bought by
Patel Renuka
Home Financials for this Owner
Home Financials are based on the most recent Mortgage that was taken out on this home.
Original Mortgage
$340,000
Interest Rate
4.58%
Mortgage Type
Negative Amortization
Purchase Details
Closed on
Nov 16, 1995
Sold by
Patel Renuka
Bought by
Patel Ramesh K and Patel Girish K
Purchase Details
Closed on
Oct 12, 1995
Sold by
Patel Atmaram K and Patel Renuka
Bought by
Patel Renuka
Create a Home Valuation Report for This Property
The Home Valuation Report is an in-depth analysis detailing your home's value as well as a comparison with similar homes in the area
Home Values in the Area
Average Home Value in this Area
Purchase History
| Date | Buyer | Sale Price | Title Company |
|---|---|---|---|
| Patel Renuka | -- | First American Title | |
| Patel Renuka | $168,500 | First American Title | |
| Patel Arpit Alex | -- | -- | |
| Patel Renuka | -- | Chicago Title | |
| Patel Ramesh K | -- | -- | |
| Patel Renuka | -- | -- |
Source: Public Records
Mortgage History
| Date | Status | Borrower | Loan Amount |
|---|---|---|---|
| Open | Patel Renuka | $224,200 | |
| Previous Owner | Patel Renuka | $340,000 |
Source: Public Records
Tax History Compared to Growth
Tax History
| Year | Tax Paid | Tax Assessment Tax Assessment Total Assessment is a certain percentage of the fair market value that is determined by local assessors to be the total taxable value of land and additions on the property. | Land | Improvement |
|---|---|---|---|---|
| 2025 | $11,043 | $740,285 | $214,850 | $525,435 |
| 2024 | $11,043 | $725,771 | $210,638 | $515,133 |
| 2023 | $10,820 | $711,541 | $206,508 | $505,033 |
| 2022 | $10,750 | $697,590 | $202,459 | $495,131 |
| 2021 | $10,553 | $683,913 | $198,490 | $485,423 |
| 2020 | $11,933 | $676,901 | $196,455 | $480,446 |
| 2019 | $9,850 | $663,629 | $192,603 | $471,026 |
| 2018 | $9,782 | $650,618 | $188,827 | $461,791 |
| 2017 | $9,603 | $637,862 | $185,125 | $452,737 |
| 2016 | $9,166 | $625,356 | $181,496 | $443,860 |
| 2015 | $9,047 | $615,963 | $178,770 | $437,193 |
| 2014 | $8,361 | $603,898 | $175,269 | $428,629 |
Source: Public Records
Map
Nearby Homes
- 3603 Meadowlands Ln
- 8411 Chenin Blanc Ln
- 8718 Mccarty Ranch Dr
- 8423 Chenin Blanc Ln
- 6252 Placid Ct
- 8386 Riesling Way
- 8501 Grenache Ct
- 8480 Grenache Ct Unit 8480
- 8366 Riesling Way
- 8356 Charbono Ct
- 8845 Wine Valley Cir
- 8449 Traminer Ct
- 8853 Wine Valley Cir
- 7886 Moorfoot Ct Unit 7886
- 8463 Traminer Ct
- 8030 Pinot Noir Ct
- 8021 Pinot Noir Ct Unit 8021
- 7530 Morevern Cir
- 7638 Falkirk Dr Unit 7638
- 7713 Galloway Dr
- 6441 Rolling Meadow Ct
- 6487 Spring Meadow Ct
- 6450 Rolling Meadow Ct
- 3428 Royal Meadow Ln
- 6497 Spring Meadow Ct
- 6477 Spring Meadow Ct
- 3426 Royal Meadow Ln
- 6421 Rolling Meadow Ct
- 3110 Royal Meadow Ln
- 3424 Royal Meadow Ln
- 6424 Grand Meadow Ln
- 6457 Spring Meadow Ct
- 3130 Royal Meadow Ln
- 6420 Grand Meadow Ln
- 6401 Rolling Meadow Ct
- 3422 Royal Meadow Ln
- 6492 Spring Meadow Ct
- 6482 Spring Meadow Ct
- 6447 Spring Meadow Ct
- 3150 Royal Meadow Ln