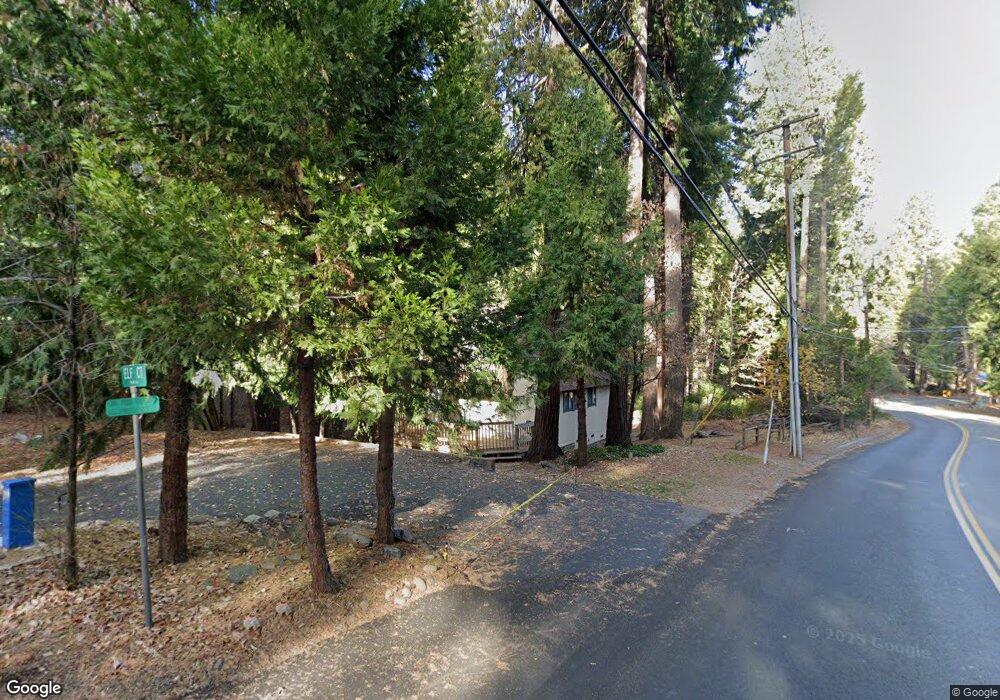
6469 Elf Ct Pollock Pines, CA 95726
Estimated Value: $257,343 - $359,000
3
Beds
1
Bath
1,008
Sq Ft
$314/Sq Ft
Est. Value
About This Home
This home is located at 6469 Elf Ct, Pollock Pines, CA 95726 and is currently estimated at $316,836, approximately $314 per square foot. 6469 Elf Ct is a home located in El Dorado County with nearby schools including Pinewood Elementary School, Sierra Ridge Middle School, and El Dorado High School.
Ownership History
Date
Name
Owned For
Owner Type
Purchase Details
Closed on
Apr 18, 2023
Sold by
Vella Thomas P and Vella Liane K
Bought by
Thomas Vella And Liane Vella Revocable Trust
Current Estimated Value
Purchase Details
Closed on
Jan 27, 1997
Sold by
Va
Bought by
Vella Thomas P and Vella Liane K
Home Financials for this Owner
Home Financials are based on the most recent Mortgage that was taken out on this home.
Original Mortgage
$71,100
Interest Rate
7.74%
Mortgage Type
Seller Take Back
Purchase Details
Closed on
May 22, 1996
Sold by
Davis Dennis and Davis Joanne
Bought by
Countrywide Funding Corp
Purchase Details
Closed on
Feb 23, 1996
Sold by
Countrywide Funding Corp
Bought by
Va
Purchase Details
Closed on
Apr 18, 1995
Sold by
Davis Joanne
Bought by
Davis Dennis W
Create a Home Valuation Report for This Property
The Home Valuation Report is an in-depth analysis detailing your home's value as well as a comparison with similar homes in the area
Home Values in the Area
Average Home Value in this Area
Purchase History
| Date | Buyer | Sale Price | Title Company |
|---|---|---|---|
| Thomas Vella And Liane Vella Revocable Trust | -- | None Listed On Document | |
| Vella Thomas P | -- | None Listed On Document | |
| Vella Thomas P | -- | -- | |
| Countrywide Funding Corp | $64,861 | First American Title Co | |
| Va | -- | First American Title Ins Co | |
| Davis Dennis W | -- | -- |
Source: Public Records
Mortgage History
| Date | Status | Borrower | Loan Amount |
|---|---|---|---|
| Previous Owner | Vella Thomas P | $71,100 |
Source: Public Records
Tax History
| Year | Tax Paid | Tax Assessment Tax Assessment Total Assessment is a certain percentage of the fair market value that is determined by local assessors to be the total taxable value of land and additions on the property. | Land | Improvement |
|---|---|---|---|---|
| 2025 | $1,417 | $128,625 | $47,210 | $81,415 |
| 2024 | $1,417 | $126,104 | $46,285 | $79,819 |
| 2023 | $1,391 | $123,632 | $45,378 | $78,254 |
| 2022 | $1,371 | $121,209 | $44,489 | $76,720 |
| 2021 | $1,357 | $118,833 | $43,617 | $75,216 |
| 2020 | $1,339 | $117,615 | $43,170 | $74,445 |
| 2019 | $1,319 | $115,310 | $42,324 | $72,986 |
| 2018 | $1,278 | $113,050 | $41,495 | $71,555 |
| 2017 | $1,242 | $110,834 | $40,682 | $70,152 |
| 2016 | $1,225 | $108,662 | $39,885 | $68,777 |
| 2015 | $1,198 | $107,032 | $39,287 | $67,745 |
| 2014 | $1,198 | $104,937 | $38,518 | $66,419 |
Source: Public Records
Map
Nearby Homes
- 2797 Forebay Rd
- 2933 Forebay Rd Unit 10
- 2933 Forebay Rd Unit 25
- 12 Rim St
- 6298 Fairview Dr
- 2893 Polaris St
- 6224 Drop Off Rd
- 3060 Leaf Cir
- 2925 Maple Ave
- 3220 Sly Park Rd
- 6165 Pony Express Trail Unit 37
- 6165 Pony Express Trail Unit 20
- 6165 Pony Express Trail Unit 32
- 6780 Ridgeway Dr
- 3224 York Ct
- 1229 Blair Rd
- 2960 Back Pack Trail
- 6613 Onyx Trail
- 6922 Ridgeway Dr
- 6060 Pony Express Trail Unit 18
Your Personal Tour Guide
Ask me questions while you tour the home.