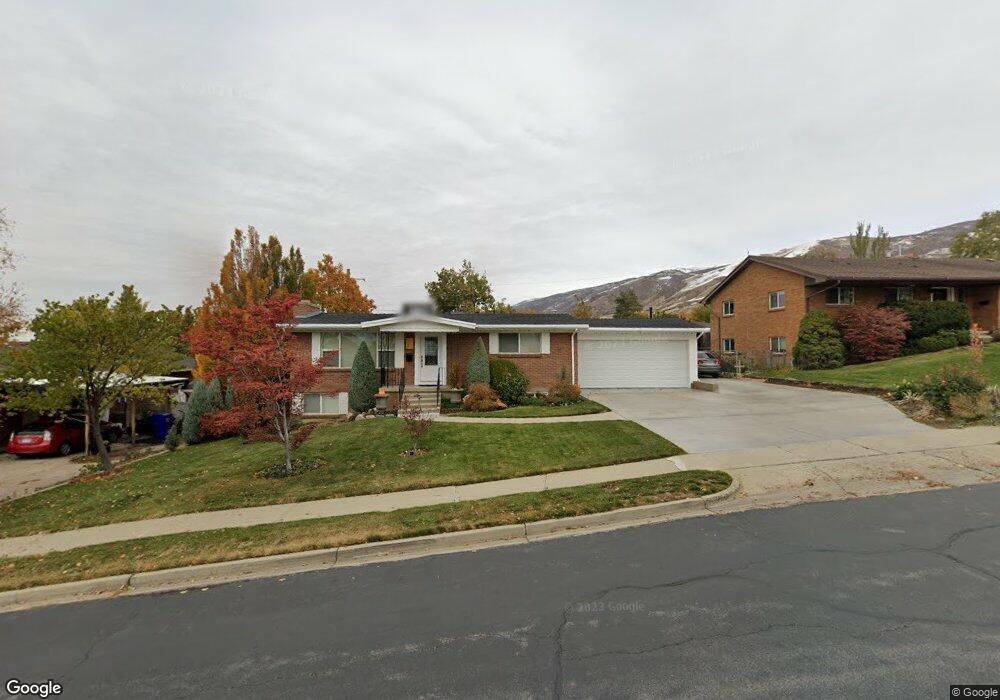
647 E Center St Bountiful, UT 84010
Estimated Value: $490,000 - $576,000
4
Beds
3
Baths
1,014
Sq Ft
$523/Sq Ft
Est. Value
About This Home
This home is located at 647 E Center St, Bountiful, UT 84010 and is currently estimated at $530,201, approximately $522 per square foot. 647 E Center St is a home located in Davis County with nearby schools including Holbrook Elementary School, Bountiful Junior High School, and Bountiful High School.
Ownership History
Date
Name
Owned For
Owner Type
Purchase Details
Closed on
Jan 21, 2011
Sold by
Thomas Gary and Thomas Bonni N
Bought by
Thomas Nicole
Current Estimated Value
Home Financials for this Owner
Home Financials are based on the most recent Mortgage that was taken out on this home.
Original Mortgage
$100,000
Interest Rate
4.82%
Mortgage Type
New Conventional
Purchase Details
Closed on
Jun 1, 2009
Sold by
Thomas Gary R and Thomas Nicole
Bought by
Thomas Nicole
Create a Home Valuation Report for This Property
The Home Valuation Report is an in-depth analysis detailing your home's value as well as a comparison with similar homes in the area
Purchase History
| Date | Buyer | Sale Price | Title Company |
|---|---|---|---|
| Thomas Nicole | -- | Accommodation | |
| Thomas Gary | -- | Atlas Title Murray | |
| Thomas Nicole | -- | None Available |
Source: Public Records
Mortgage History
| Date | Status | Borrower | Loan Amount |
|---|---|---|---|
| Closed | Thomas Gary | $100,000 |
Source: Public Records
Tax History
| Year | Tax Paid | Tax Assessment Tax Assessment Total Assessment is a certain percentage of the fair market value that is determined by local assessors to be the total taxable value of land and additions on the property. | Land | Improvement |
|---|---|---|---|---|
| 2025 | $2,918 | $263,450 | $130,096 | $133,354 |
| 2024 | $2,722 | $255,200 | $120,006 | $135,194 |
| 2023 | $2,611 | $444,000 | $216,839 | $227,161 |
| 2022 | $2,421 | $224,400 | $115,360 | $109,040 |
| 2021 | $2,214 | $314,000 | $171,394 | $142,606 |
| 2020 | $1,952 | $277,000 | $156,080 | $120,920 |
| 2019 | $1,989 | $276,000 | $155,429 | $120,571 |
| 2018 | $1,829 | $249,000 | $144,156 | $104,844 |
| 2016 | $1,601 | $118,195 | $45,356 | $72,839 |
| 2015 | $1,576 | $109,780 | $45,356 | $64,424 |
| 2014 | $1,616 | $116,430 | $45,356 | $71,074 |
| 2013 | -- | $113,009 | $43,945 | $69,064 |
Source: Public Records
Map
Nearby Homes
- 683 E 100 N
- 129 N 800 E
- 6 N 800 E
- 698 E 200 S
- 513 N 400 E Unit 14B
- 453 N 400 E Unit 7-D
- 456 E 500 S
- 255 E 400 S
- 520 S Orchard Dr Unit 17
- 275 E Peach Ln S
- 323 Peach Ln
- 1138 Briggs Dr
- 357 S 100 E
- 49 E 200 N Unit 4
- 41 E 200 N Unit 6
- 55 E 200 N Unit 2
- 51 E 200 N Unit 3
- 254 N Main St
- 256 N Main St
- 252 N Main St
Your Personal Tour Guide
Ask me questions while you tour the home.