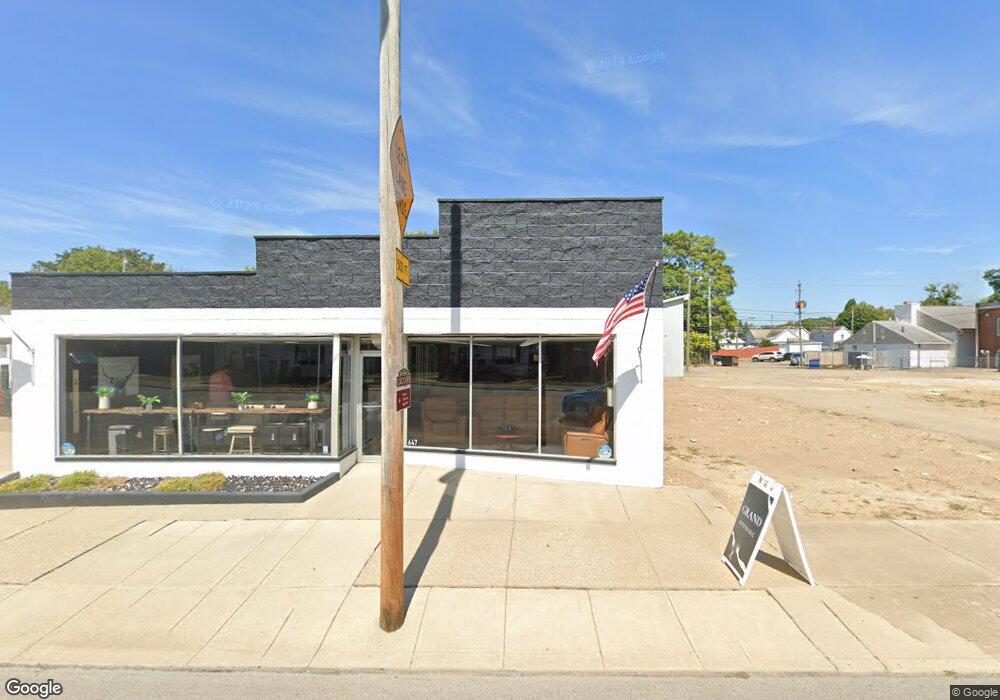
647 E Main St Lancaster, OH 43130
Studio
--
Bath
9,316
Sq Ft
20,038
Sq Ft Lot
About This Home
This home is located at 647 E Main St, Lancaster, OH 43130. 647 E Main St is a home located in Fairfield County with nearby schools including Thomas Ewing Junior High School, Lancaster High School, and St Mary Elementary School.
Ownership History
Date
Name
Owned For
Owner Type
Purchase Details
Closed on
Aug 20, 2024
Sold by
Trimain Llc
Bought by
Alvis David M and Stern Valerie R
Home Financials for this Owner
Home Financials are based on the most recent Mortgage that was taken out on this home.
Original Mortgage
$300,000
Outstanding Balance
$47,219
Interest Rate
6.89%
Purchase Details
Closed on
Aug 14, 2024
Sold by
Trimain Llc
Bought by
Alvis David M and Stern Valerie R
Home Financials for this Owner
Home Financials are based on the most recent Mortgage that was taken out on this home.
Original Mortgage
$300,000
Outstanding Balance
$47,219
Interest Rate
6.89%
Purchase Details
Closed on
Oct 8, 2008
Sold by
Riegel Helen M
Bought by
Trimain Llc
Purchase Details
Closed on
Jul 24, 2008
Sold by
Kline George A and The Kline Family Trust
Bought by
Riegel Helen M
Create a Home Valuation Report for This Property
The Home Valuation Report is an in-depth analysis detailing your home's value as well as a comparison with similar homes in the area
Home Values in the Area
Average Home Value in this Area
Purchase History
| Date | Buyer | Sale Price | Title Company |
|---|---|---|---|
| Alvis David M | $672,000 | Hocking Valley Title | |
| Alvis David M | $672,000 | Hocking Valley Title | |
| Trimain Llc | -- | Attorney | |
| Riegel Helen M | $123,000 | Attorney |
Source: Public Records
Mortgage History
| Date | Status | Borrower | Loan Amount |
|---|---|---|---|
| Open | Alvis David M | $300,000 | |
| Closed | Alvis David M | $300,000 | |
| Closed | Alvis David M | $372,000 | |
| Closed | Alvis David M | $372,000 |
Source: Public Records
Tax History
| Year | Tax Paid | Tax Assessment Tax Assessment Total Assessment is a certain percentage of the fair market value that is determined by local assessors to be the total taxable value of land and additions on the property. | Land | Improvement |
|---|---|---|---|---|
| 2025 | $5,124 | $92,430 | $15,870 | $76,560 |
| 2024 | $5,124 | $57,000 | $8,380 | $48,620 |
| 2023 | $2,899 | $57,000 | $8,380 | $48,620 |
| 2022 | $2,923 | $57,000 | $8,380 | $48,620 |
| 2021 | $3,006 | $57,000 | $8,380 | $48,620 |
| 2020 | $2,791 | $57,000 | $8,380 | $48,620 |
| 2019 | $2,791 | $57,000 | $8,380 | $48,620 |
| 2018 | $2,871 | $57,000 | $8,380 | $48,620 |
| 2017 | $2,857 | $59,910 | $8,380 | $51,530 |
| 2016 | $2,760 | $59,910 | $8,380 | $51,530 |
| 2015 | $2,787 | $59,910 | $8,380 | $51,530 |
| 2014 | $2,664 | $59,910 | $8,380 | $51,530 |
| 2013 | $2,664 | $59,910 | $8,380 | $51,530 |
Source: Public Records
Map
Nearby Homes
- 545 E Main St
- 621 E Mulberry St
- 534 E Wheeling St
- 547 E Mulberry St
- 515 E Chestnut St
- 641 King St
- 844 E Wheeling St
- 846 E Main St
- 859 E Mulberry St
- 869 E Mulberry St
- 1006 King St
- 414 E Walnut St
- 342 E Chestnut St
- 517 N Maple St
- 736 E Allen St
- 249 N Pearl Ave
- 1106 E Walnut St
- 1113 E Locust St
- 705 Madison Ave
- 632 N Eastwood Ave
- 649 E Main St
- 651 E Main St
- 627 E Main St
- 650 E Main St
- 623 E Main St
- 646 E Main St
- 642 E Wheeling St
- 644 E Wheeling St
- 621 E Main St
- 646 E Wheeling St
- 636 E Main St
- 630 E Main St
- 634 E Wheeling St
- 648 E Wheeling St
- 662 E Main St
- 632 E Main St
- 654 E Main St
- 626 E Main St
- 662 E Main St
- 624 E Wheeling St
Your Personal Tour Guide
Ask me questions while you tour the home.