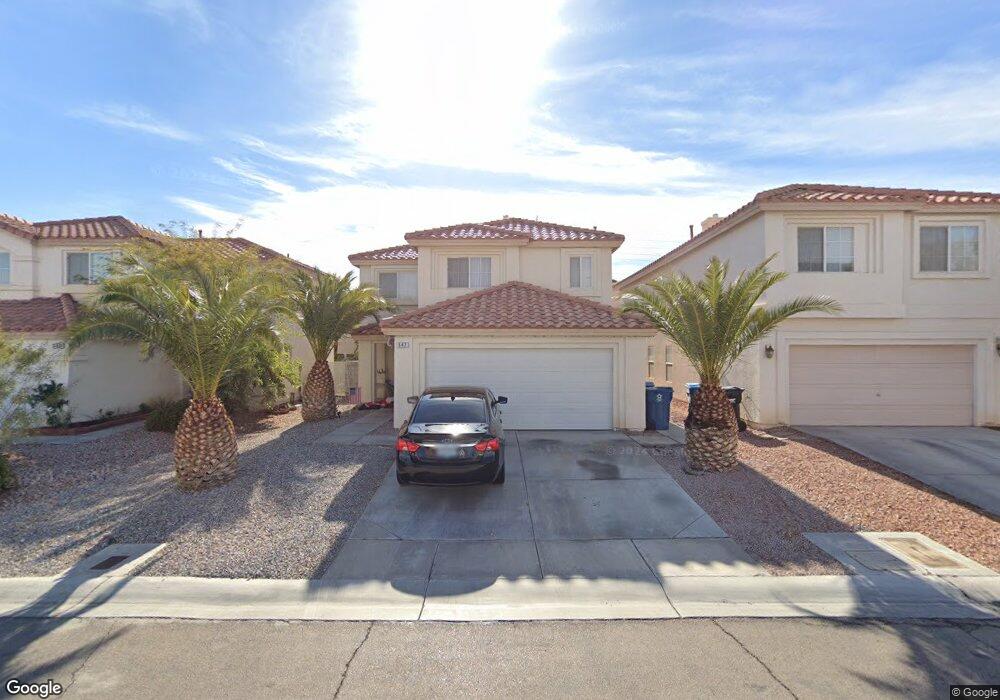
647 Persian Violet Ave Las Vegas, NV 89183
Silverado Ranch NeighborhoodEstimated Value: $449,840 - $487,000
4
Beds
3
Baths
2,211
Sq Ft
$212/Sq Ft
Est. Value
About This Home
This home is located at 647 Persian Violet Ave, Las Vegas, NV 89183 and is currently estimated at $468,210, approximately $211 per square foot. 647 Persian Violet Ave is a home located in Clark County with nearby schools including John C. Bass Elementary School, Charles Silvestri Junior High School, and Liberty High School.
Ownership History
Date
Name
Owned For
Owner Type
Purchase Details
Closed on
Mar 30, 2012
Sold by
Fannie Mae
Bought by
Lin Xiaobin and Tang Xiqian
Current Estimated Value
Home Financials for this Owner
Home Financials are based on the most recent Mortgage that was taken out on this home.
Original Mortgage
$104,250
Outstanding Balance
$71,734
Interest Rate
3.83%
Mortgage Type
New Conventional
Estimated Equity
$396,476
Purchase Details
Closed on
Oct 18, 2011
Sold by
Rubio Cornelio and Rubio Mila
Bought by
Fannie Mae and Federal National Mortgage Association
Purchase Details
Closed on
Jan 19, 2000
Sold by
American West Homes Inc
Bought by
Rubio Cornelio and Rubio Mila
Home Financials for this Owner
Home Financials are based on the most recent Mortgage that was taken out on this home.
Original Mortgage
$151,113
Interest Rate
8.27%
Mortgage Type
VA
Create a Home Valuation Report for This Property
The Home Valuation Report is an in-depth analysis detailing your home's value as well as a comparison with similar homes in the area
Home Values in the Area
Average Home Value in this Area
Purchase History
| Date | Buyer | Sale Price | Title Company |
|---|---|---|---|
| Lin Xiaobin | $137,000 | Stewart Title Las Vegas War | |
| Fannie Mae | $257,075 | Accommodation | |
| Fannie Mae | $257,075 | Accommodation | |
| Rubio Cornelio | $148,150 | First American Title Co |
Source: Public Records
Mortgage History
| Date | Status | Borrower | Loan Amount |
|---|---|---|---|
| Open | Lin Xiaobin | $104,250 | |
| Previous Owner | Rubio Cornelio | $151,113 |
Source: Public Records
Tax History Compared to Growth
Tax History
| Year | Tax Paid | Tax Assessment Tax Assessment Total Assessment is a certain percentage of the fair market value that is determined by local assessors to be the total taxable value of land and additions on the property. | Land | Improvement |
|---|---|---|---|---|
| 2025 | $2,537 | $118,515 | $37,800 | $80,715 |
| 2024 | $2,349 | $118,515 | $37,800 | $80,715 |
| 2023 | $2,349 | $112,894 | $36,400 | $76,494 |
| 2022 | $2,176 | $97,580 | $27,650 | $69,930 |
| 2021 | $2,015 | $91,270 | $24,850 | $66,420 |
| 2020 | $1,868 | $90,252 | $24,500 | $65,752 |
| 2019 | $1,750 | $86,252 | $21,350 | $64,902 |
| 2018 | $1,670 | $79,346 | $17,150 | $62,196 |
| 2017 | $2,321 | $79,150 | $16,100 | $63,050 |
| 2016 | $1,564 | $73,647 | $12,250 | $61,397 |
| 2015 | $1,564 | $60,975 | $9,800 | $51,175 |
| 2014 | $1,515 | $50,114 | $7,000 | $43,114 |
Source: Public Records
Map
Nearby Homes
- 10266 Martinsburg Ct
- 10208 Ghost Gum St
- 680 Steep Canyon Ave
- 10133 Rice Paper St
- 638 Ribbon Grass Ave
- 10142 Rice Paper St
- 627 Steep Canyon Ave
- 10339 Baby Bud St
- 10366 Emerald Rye St
- 628 Soaring Wings Ave
- 508 Candy Mint Ave
- 10164 Tree Bark St
- 10374 Baby Bud St
- 645 Soaring Wings Ave
- 10366 Midseason Mist St
- 647 Great River Ave
- 10025 Catseye Cove Ct
- 10151 Tumbling Tree St
- 10414 Midseason Mist St
- 10013 Solid Lime St
- 647 Persian Violet Ave
- 647 Persian Violet Ave
- 647 Persian Violet Ave
- 641 Persian Violet Ave
- 653 Persian Violet Ave
- 10255 Union Park Ct
- 659 Persian Violet Ave
- 10254 Pennypack Ct
- 10256 Union Park Ct
- 10260 Pennypack Ct Unit 2
- 665 Persian Violet Ave
- 629 Persian Violet Ave
- 10253 Pennypack Ct
- 10262 Union Park Ct
- 10227 Crepe Myrtle Ct
- 10226 Climbing Lily St
- 10259 Pennypack Ct
- 10267 Union Park Ct Unit 2
- 10257 Trinidad Ct