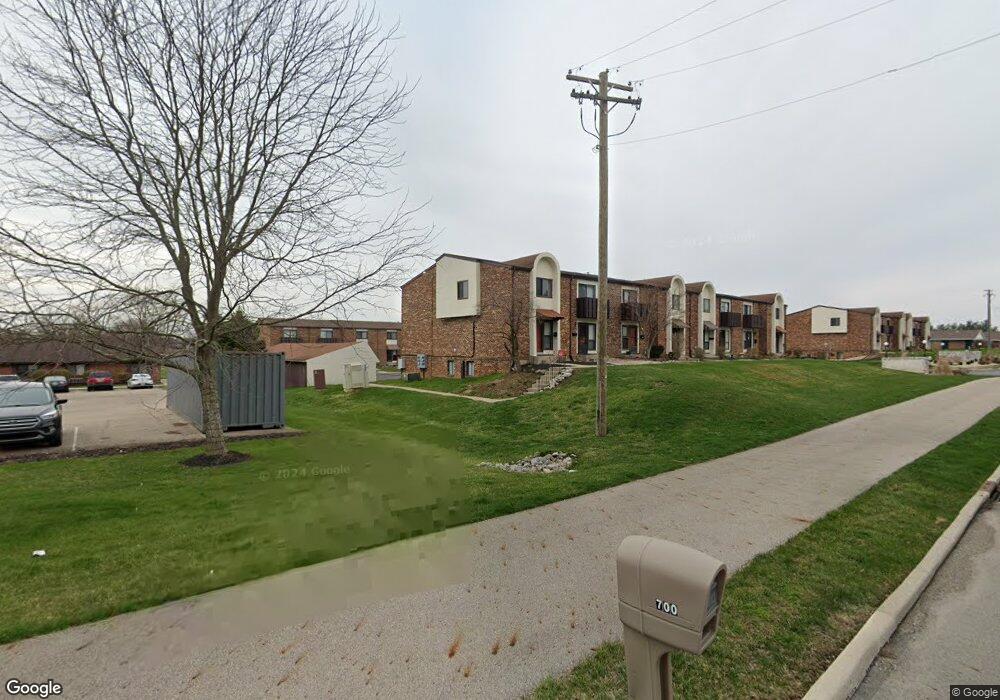
647 Villa Rd Unit F Springfield, OH 45503
Estimated Value: $81,301 - $142,000
2
Beds
2
Baths
1,184
Sq Ft
$90/Sq Ft
Est. Value
About This Home
This home is located at 647 Villa Rd Unit F, Springfield, OH 45503 and is currently estimated at $106,767, approximately $90 per square foot. 647 Villa Rd Unit F is a home located in Clark County with nearby schools including Kenton Elementary School, Roosevelt Middle School, and Springfield High School.
Ownership History
Date
Name
Owned For
Owner Type
Purchase Details
Closed on
Jan 25, 2023
Sold by
Dodridge Llc
Bought by
Lemon James N and Lemon Judith A
Current Estimated Value
Purchase Details
Closed on
Oct 21, 2016
Sold by
Blanton Sarah M and Lakeview Loan Servicing Llc
Bought by
Dodridge Llc
Purchase Details
Closed on
Jun 16, 2010
Sold by
Blanton Robert J and Blanton Janice K
Bought by
Blanton Sarah M
Home Financials for this Owner
Home Financials are based on the most recent Mortgage that was taken out on this home.
Original Mortgage
$29,550
Interest Rate
5.25%
Mortgage Type
FHA
Purchase Details
Closed on
May 18, 2009
Sold by
Roberts Vicki Lou Taylor and Roberts David Ray
Bought by
Blanton Sarah M and Blanton Robert J
Home Financials for this Owner
Home Financials are based on the most recent Mortgage that was taken out on this home.
Original Mortgage
$27,492
Interest Rate
4.83%
Mortgage Type
FHA
Purchase Details
Closed on
Oct 1, 1980
Bought by
Taylor Vicki Lou
Create a Home Valuation Report for This Property
The Home Valuation Report is an in-depth analysis detailing your home's value as well as a comparison with similar homes in the area
Home Values in the Area
Average Home Value in this Area
Purchase History
| Date | Buyer | Sale Price | Title Company |
|---|---|---|---|
| Lemon James N | $55,000 | -- | |
| Dodridge Llc | $17,011 | None Available | |
| Blanton Sarah M | -- | None Available | |
| Blanton Sarah M | $28,000 | Attorney | |
| Taylor Vicki Lou | $41,700 | -- |
Source: Public Records
Mortgage History
| Date | Status | Borrower | Loan Amount |
|---|---|---|---|
| Previous Owner | Blanton Sarah M | $29,550 | |
| Previous Owner | Blanton Sarah M | $27,492 |
Source: Public Records
Tax History Compared to Growth
Tax History
| Year | Tax Paid | Tax Assessment Tax Assessment Total Assessment is a certain percentage of the fair market value that is determined by local assessors to be the total taxable value of land and additions on the property. | Land | Improvement |
|---|---|---|---|---|
| 2024 | $621 | $12,580 | $2,020 | $10,560 |
| 2023 | $621 | $12,580 | $2,020 | $10,560 |
| 2022 | $637 | $12,580 | $2,020 | $10,560 |
| 2021 | $775 | $14,110 | $1,930 | $12,180 |
| 2020 | $777 | $14,110 | $1,930 | $12,180 |
| 2019 | $779 | $14,110 | $1,930 | $12,180 |
| 2018 | $668 | $11,620 | $1,490 | $10,130 |
| 2017 | $668 | $12,741 | $1,488 | $11,253 |
| 2016 | $650 | $12,741 | $1,488 | $11,253 |
| 2015 | $876 | $14,704 | $1,750 | $12,954 |
| 2014 | $800 | $14,704 | $1,750 | $12,954 |
| 2013 | $792 | $14,704 | $1,750 | $12,954 |
Source: Public Records
Map
Nearby Homes
- 647 Villa Rd Unit A
- 542 Villa Rd
- 732 Grandview Dr Unit 732
- 2933 Stonehaven Dr
- 1225 Vester Ave
- 2933 Bahia Dr
- 3032 Armsgate Rd Unit 25
- 3029 Bradford Dr Unit 46
- 2813 Wellsford Dr
- 3046 Brixton Dr W Unit 173
- 537 Rensselaer St
- 2683 Home Orchard Dr
- 2677 Carousel Dr
- 1148 Foxboro Rd
- 1506 Hyannis Dr
- 2524 Home Orchard Dr
- 1732 Falmouth Ave
- 2516 Balsam Dr
- 2541 Derr Rd
- 2540 Rebecca Dr
- 647 Villa Rd Unit H
- 647 Villa Rd Unit I
- 647 Villa Rd Unit G
- 647 Villa Rd Unit J
- 647 Villa Rd Unit 647E
- 647 Villa Rd Unit D
- 647 Villa Rd Unit K
- 647 Villa Rd Unit C
- 647 Villa Rd Unit B
- 647 Villa Rd Unit L
- 647 Villa Rd Unit 647-A
- 647 Villa Rd
- 647 Villa Rd Unit 647-G
- 647 Villa Rd #C
- 613 Villa Rd Unit H
- 613 Villa Rd Unit I
- 613 Villa Rd Unit G
- 613 Villa Rd Unit F
- 613 Villa Rd Unit J
- 613 Villa Rd Unit 613E